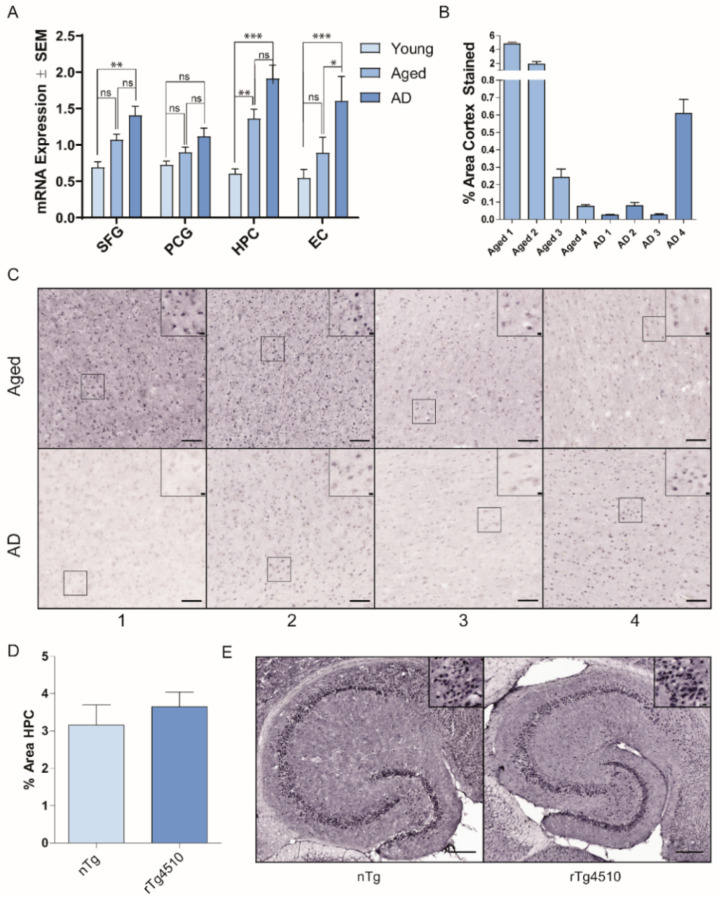
Figure 1.
Expression levels of Hsp22 at the mRNA and protein levels. (A) Microarray analysis was undertaken on 4 human brain regions, the superior frontal gyrus (SFG), posterior cingulate gyrus (PCG), hippocampus (HPC) and entorhinal cortex (EC), from young normal cases (ages 20 to 59; n = 21,18,19,21, respectively), age-matched controls (age 60–99 yrs, n = 14, 21, 21, 21, respectively), and AD cases (age 74–95, n = 15, 18, 24, 21, respectively). Data were analyzed by one-way ANOVA with Dunnet’s post hoc comparisons test, * p < 0.05; ** p < 0.01; *** p < 0.001). (B,C) Medial temporal gyrus tissue samples from four aged and four AD brains were evaluated by immunohistochemical staining with an antibody to Hsp22. The mean area of medial temporal gyrus Hsp22 positive staining from 10 random fields per patient is shown. Representative images from each patient are shown. Scale bars reflect 100 µm and 10 µm (inset boxes). (D) Mean % area of Hsp22 staining in the hippocampus from 4 non-transgenic and 4 rTg4510 mice. (E) Representative images of Hsp22 staining in nTg and rTg4510 brain tissue. Scale bars reflect 200 µm and 10 µm (inset boxes).

