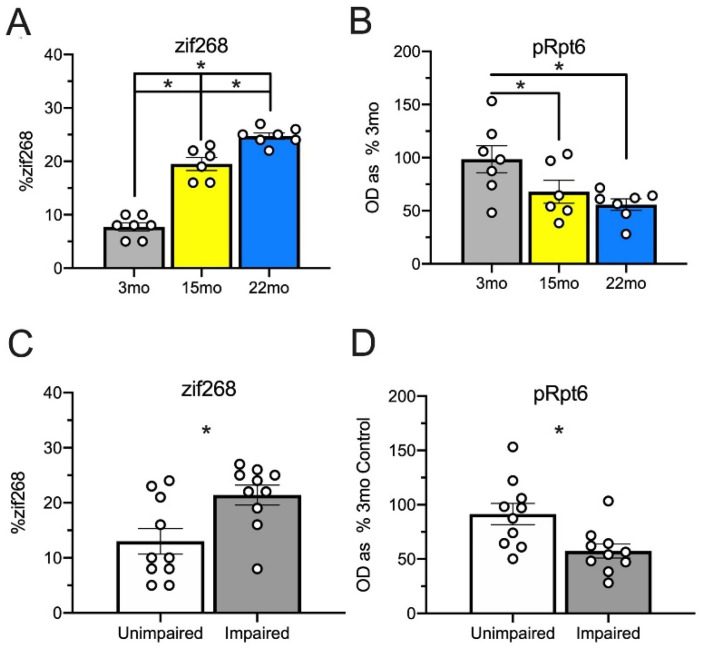
Figure 7.
Levels of zif268 expression and pRpt6 in each ROI were averaged throughout the entire brain for each animal. Panels (A,B) represent zif268 (A) and pRpt6 (B) levels with groups constructed based on age group. zif268 levels differ between all age groups (A). Both 15-month-old and 22-month-old animals showed less pRpt6 than 3-month-old animals, but did not differ from each other. (B) Panels (C,D) represent zif268 (C) and pRpt6 (D) levels with groups constructed based on behavioral performance defined by a median split. Animals with impaired memory performance showed increased zif268 (C) and decreased pRpt6 (D) relative to unimpaired animals. Asterisks indicate p < 0.05. White dots represent individual rats.

