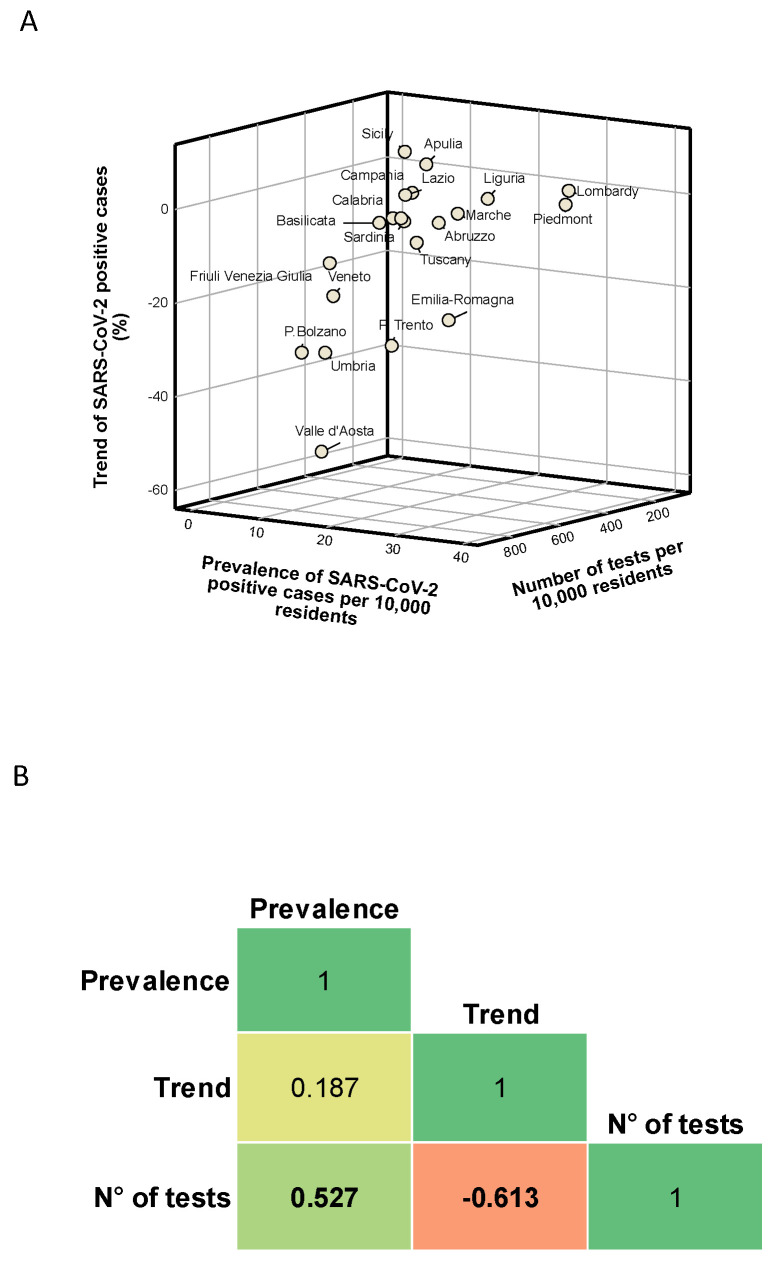
Figure 1.
Description and correlation of regional indicators: (A) the distribution of Italian regions by prevalence of SARS-CoV-2 positive cases, their trend, and the number of tests performed; and (B) the correlations between the prevalence of SARS-CoV-2 positive cases, their trend, and the number of tests performed; the results are reported as Spearman’s correlation coefficient from −1 (in red) to 1 (in green).

