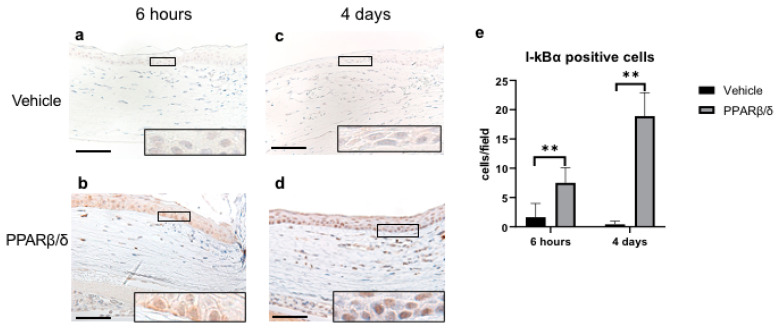
Figure 4.
Immunohistochemical analysis of I-κBα and quantitative evaluation determined by cell counting on the corneal periphery in each group. Representative sections at 6 h after injury are shown (a,b). PPARβ/δ group exhibited strong expression of I-kBα as compared to the vehicle group (see boxed area). Representative sections at day 4 after the injury are shown. I-κBα expression was only found in the PPARβ/δ group (c,d). Higher magnification pictures of the boxed area are also shown. Bar, 50 μm. There was a significantly higher number of I-κBα-positive cells in the PPARβ group versus the vehicle group at each of the time points (e). Data are presented as mean ± SD (n = 8) ** p < 0.01.

