Figure 4.
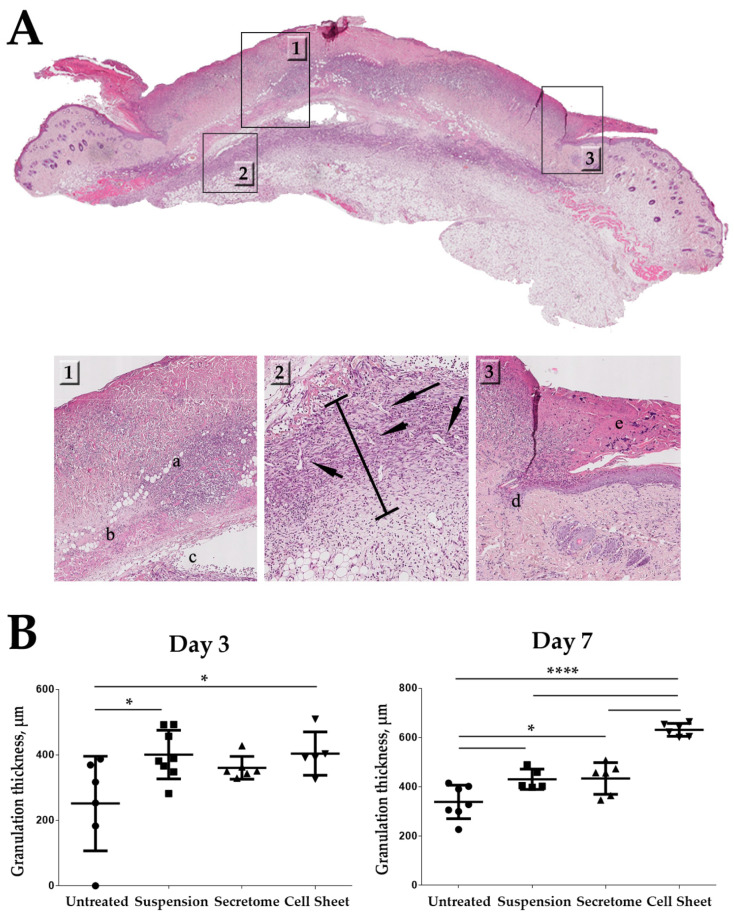
Influence of cell sheets, suspended MSC or MSC secretome on GT thickness in healing pressure ulcer. (A) Representative image of a histological section at Day 3; panel markup: 1—zone of damaged tissue down to (a) muscular layer with (b) immune cells infiltration and (c) edema of underlying tissue; 2—zone of GT formation; bar indicates measured thickness, arrows indicate blood vessels; 3—defect surface with (e) scab and (d) margin of migrating epithelial layer covering ulcer. Hematoxylin-eosin staining, scale bar represents 50 µm; (B) quantitative results of GT thickness analysis at Days 3 and 7; (*—p < 0.05; ****—p < 0.0001).

