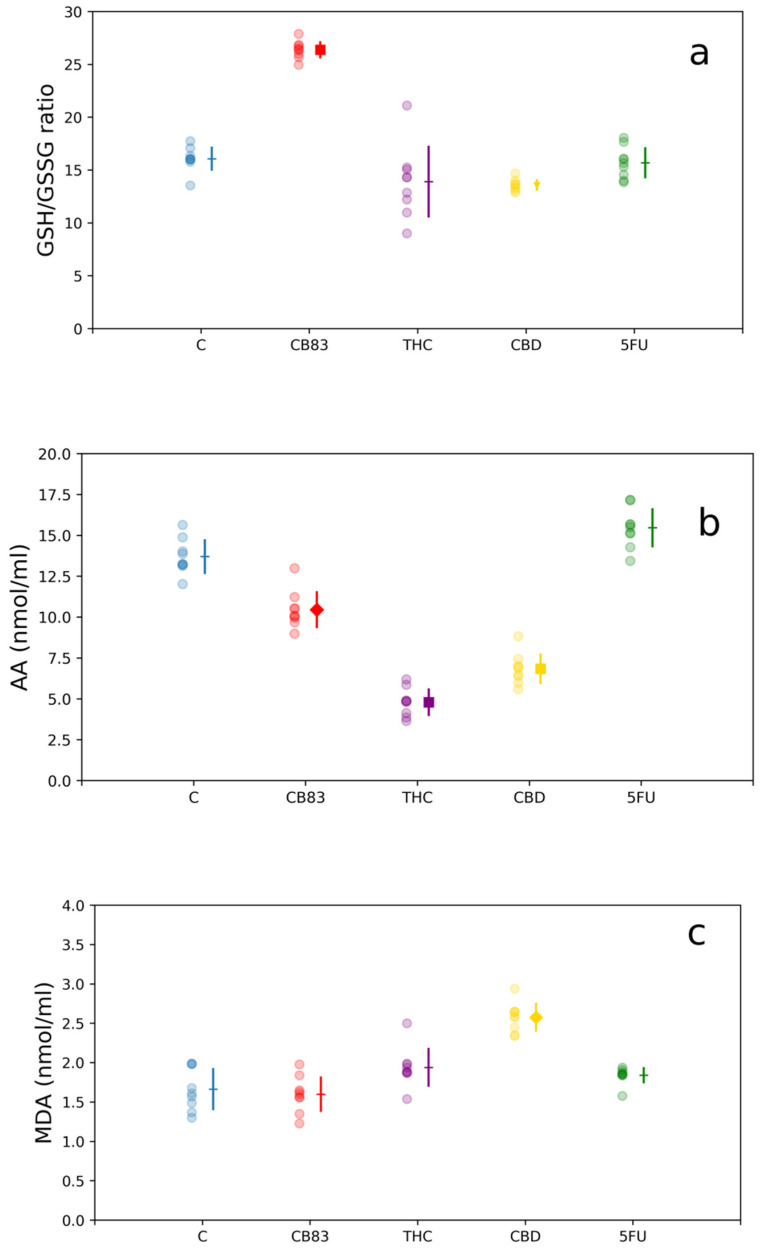
Figure 3.
Nonenzymatic antioxidant contents: (a) glutathione/oxidized glutathione (GSH/GSSG) ratio, (b) ascorbic acid (AA) levels, and (c) malondhyaldhehyde (MDA) levels in HT-29 cells exposed to IC50 of CB83, THC, CBD, and 5-Fluorouracil (5FU). Data are representative of three independent experiments. For each treatment, the experimental measurements (left side with circle marker) and mean values ± S.D. (right side) are reported. Mean value markers represent the significance vs. control (C): triangle for p < 0.05, diamond for p < 0.01, and square for p < 0.001; hyphen if dataset is not significant.

