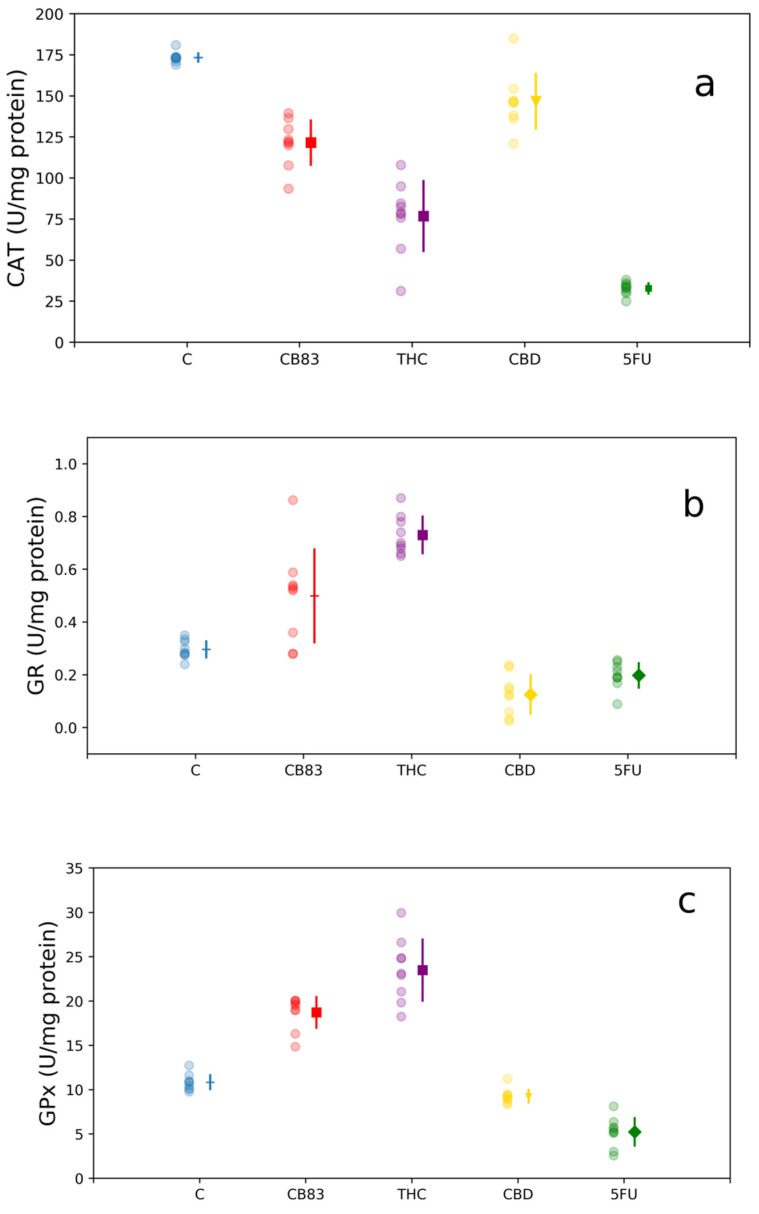
Figure 4.
Antioxidant enzymes activity: (a) catalase (CAT), (b) glutathione reductase (GR), and (c) glutathione peroxidase (GPx) in HT-29 cells exposed to IC50 of CB83, THC, CBD, and 5FU. Data are representative of three independent experiments. For each treatment, the experimental measurements (left side with circle marker) and mean values ± S.D. (right side) are reported. Mean value markers represent the significance vs. control (C): triangle for p < 0.05, diamond for p < 0.01, and square for p < 0.001; hyphen if dataset is not significant.

