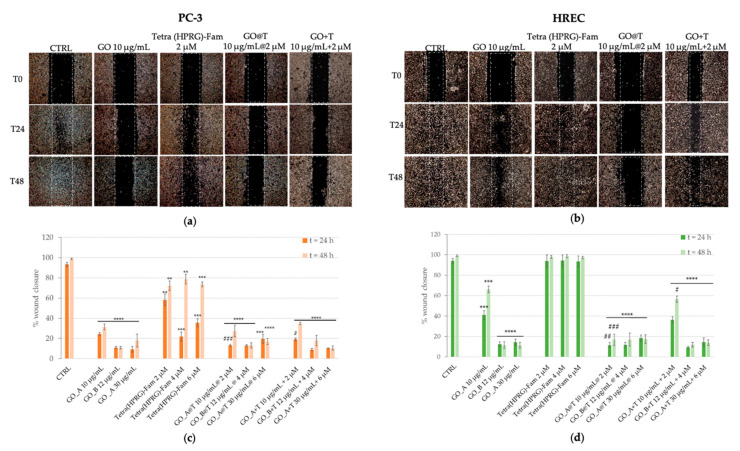
Figure 6.
Representative micrographs (a,b) and quantitative analysis of cell migration (c,d) for prostate cancer (a,c) and endothelial (b,d) cells in absence (negative control, CTRL) or in presence of the different treatments at time 0, 24 h and 48 h after scratch: GO nanosheets (10, 12, 30 µg/mL), Tetra(HPRG)-Fam peptide (2, 4, 6 µM), GO@T hybrids (10 µg/mL 2 µM, 12 µg/mL 4 µM, 30 µg/mL 6 µM of GOpeptide concentration) and GO+T mixtures. PC-3 and HREC cells were wounded as described in the Materials and Methods section. The quantitative analysis of migration assay (wound edge advancement in percent vs. time) is expressed as means values (± SEM) from three independent experiments. Statistical analysis was performed by pairwise Student’s T-test results are expressed as percentage of wound closure with respect to time 0. (**) p < 0.01, (***) p < 0.001, (****) p < 0.0001 vs. CTRL, (#) p < 0.05, (##) p < 0.01, (###) p < 0.001 vs. the corresponding GO reference sample.

