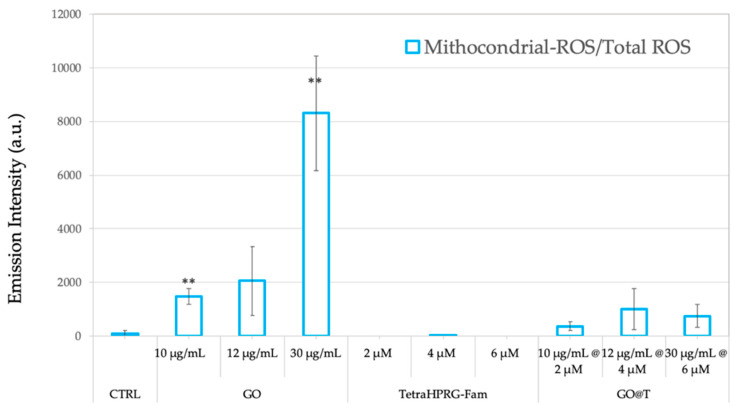
Figure 7.
Ratio of mitochondrial-reactive oxygen species (ROS)/total-ROS levels measured on prostate cancer cells (PC-3) measured by the MitoSOX and dichlorohydrofluorescein (DCF) fluorescence assays. Cells were incubated for 24 h in absence (negative control, CTRL) or in presence of the different treatments: GO nanosheets (10, 12, 30 µg/mL), Tetra(HPRG)-Fam peptide (2, 4, 6 µM) and hybrid GO@T samples (10 µg/mL-2 µM, 12 µg/mL-4 µM, 30 µg/mL-6 µM of GO-peptide concentration). Values (means ± SEM) are from three independent experiments. Statistical analysis was performed by One-way ANOVA test. Symbols indicate the significance versus CTRL: ** p < 0.01. Results are expressed as ratio of MitoSOX with respect to DCF emission intensities.

