Figure 8.
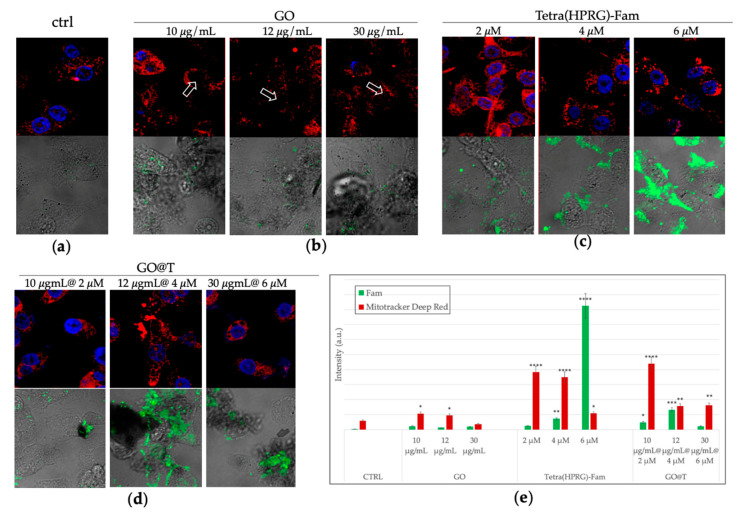
Laser scanning microscopy (LSM) micrographs of PC-3 cells incubated for 24 h in absence (a: CTRL) or in presence of the different treatments: GO nanosheets (b: 10, 12, 30 µg/mL), Tetra(HPRG)-Fam peptide (c: 2, 4, 6 µM) and hybrid GO@T samples (d: 10 µg/mL-2 µM, 12 µg/mL-4 µM, 30 µg/mL-6 µM of GO-peptide concentration). For each treatment condition, the merged confocal images of nuclei (Hoechst, λex/em = 405/425–450 nm) and mitochondria (MitoTracker Deep Red, λex/em = 633/650–700) (upper panel), and the merged fluorescence image of the dye-labelled peptide (Fam, λex/em = 543/550–600 nm) and the optical bright field micrograph (lower panel) are shown. Scale bar 30 µm. The white arrows guide the eye to the GO sheets. In (e): quantitative analysis of Fam and MitoTracker Deep Red emission intensity. Results are presented as mean +/-SEM from experiments in triplicate and normalized with respect to the control untreated cells. Asterisks represent the correlation significant at the (*) p < 0.05, (**) p < 0.01, (***) p < 0.001 (****) p < 0.0001 vs. CTRL, (One-way ANOVA).

