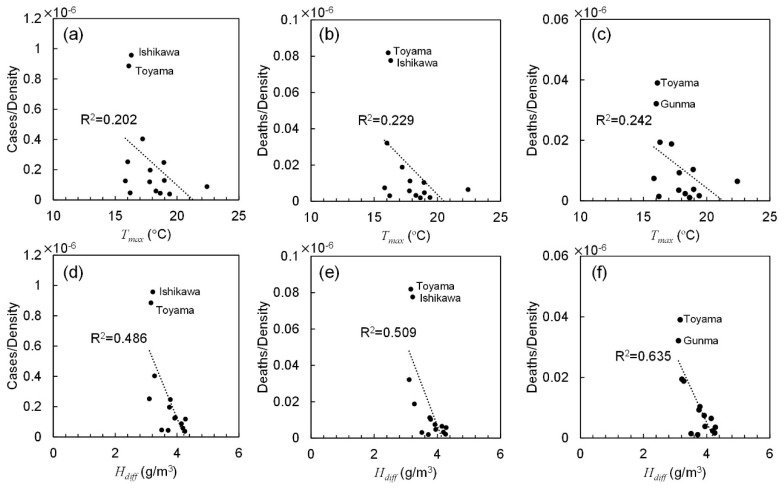
Figure 4.
Correlation between the number of confirmed positive cases and fatality normalized by the population density and (a–c) the daily maximum temperature and (d–f) diurnal absolute humidity averaged over total duration. The number of (a,d) positive cases, confirmed deaths (b,e) including and (c,f) excluding those caused by nosocomial infection.

