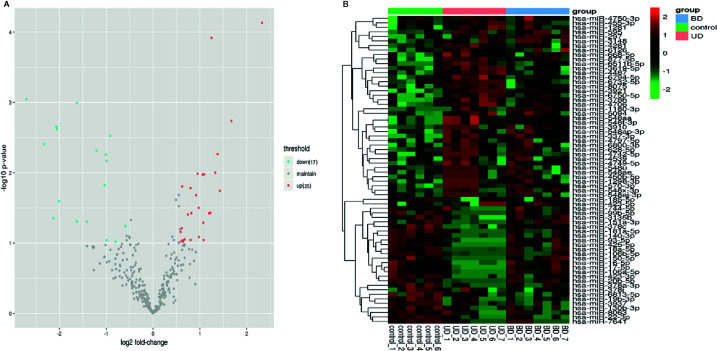
Figure 1.
(A) Volcano map of differentially expressed miRNAs. The horizontal axis is the logarithm of the fold change value based on 2, and the vertical axis is the negative logarithm of the p value based on 10. Blue dots represent down-regulated miRNAs with statistically significant differences in patients comparing healthy subjects. Red dots represent miRNAs that are up-regulated in patients, and grey dots represent miRNAs that have no significant differences in expression values between the patients and healthy controls. (B) Heat map of differentially expressed miRNAs. The abscissa represents the subject names between groups, and the ordinate represents the differentially expressed miRNAs. Differentiated miRNAs are expressed in red with high expression values and those with low expression values are in green.

