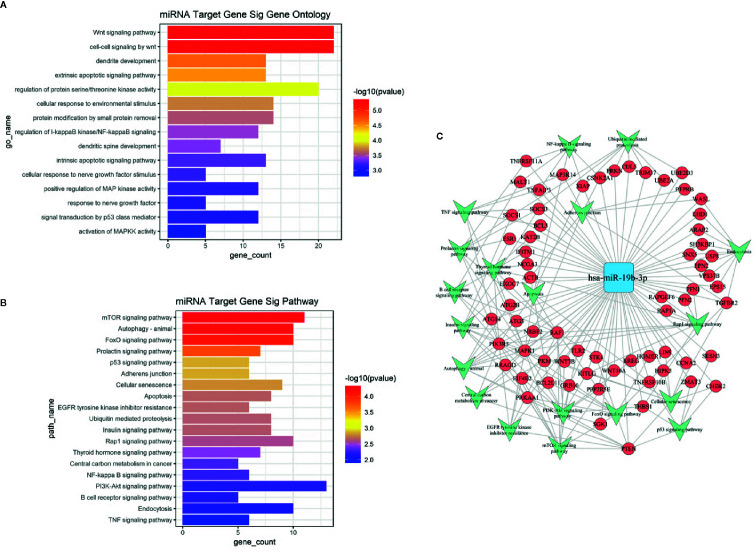
Figure 3.
(A) GO analysis of target genes predicted by miR-19b-3p. The ordinate is the name of the target gene function, and the abscissa is the negative logarithm of p value (-Lgp). The larger the -Lgp value, the smaller the p value and the higher the significance level of the target gene function. (B) KEGG signal pathway of target genes predicted by miR-19b-3p. The ordinate is the name of the target gene signal pathway, and the abscissa is the negative logarithm of p value (-Lgp). The larger the -Lgp value, the smaller the p value and the higher the significance level of the target gene signal pathway. (C) MicroRNA-Gene network diagram of miR-19b-3p. The blue square in the figure refers to miR-19b-3p, the red circle refers to target genes, and the green arrow refers to the signal pathways involved in the target gene. Lines represent the regulatory relationship between miR-19b-3p and target genes.

