Figure 2.
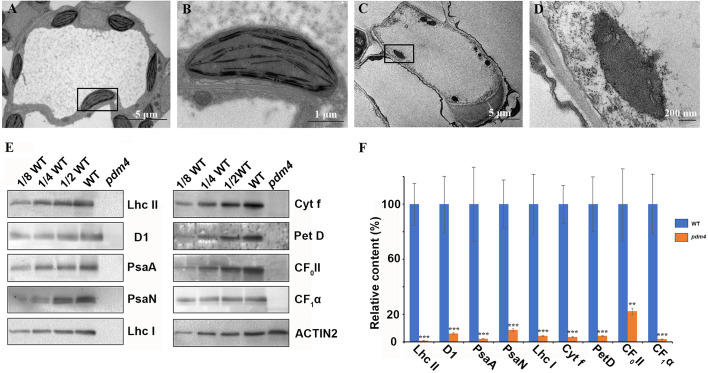
Ultrastructure of plastids and chloroplast proteins in pdm4. (A–D) The thylakoid membrane organization in the chloroplasts of wild type (A, B) and pdm4 (C, D). Scale bars: 5 μm in (A) and (C); 1 μm in (B), and 500 nm in (D). (E) Accumulation of representative subunits of photosynthetic protein complexes determined by western blot analysis with specific antibodies. Total proteins from wild-type and pdm4 seedlings were extracted and separated by 15% SDS-PAGE. Probes used specific anti-Lhc II, anti-D1, anti-PsaA, anti-PsaN, anti-Lhc I, anti-Cyt f, anti-Pet D, anti-CF0 II, anti-CF1α, and anti-ACTIN antibodies. (F) Semi-quantitative analysis of chloroplast proteins. After immunoblot analysis, the average signal intensities for each protein were quantified by the ImageJ software for three independent times. The protein relative contents (per unit of total protein) were determined and compared. Error bars represent standard errors. The relative protein level of pdm4 mutants was obtained when protein level of wild type was set to 100. Similar result to that presented in (E) was obtained from three independent experiments. Results from a representative experiment are shown. The asterisks indicate significant differences between WT and pdm4 (Student’s t test; **p < 0.01; ***p < 0.001).

