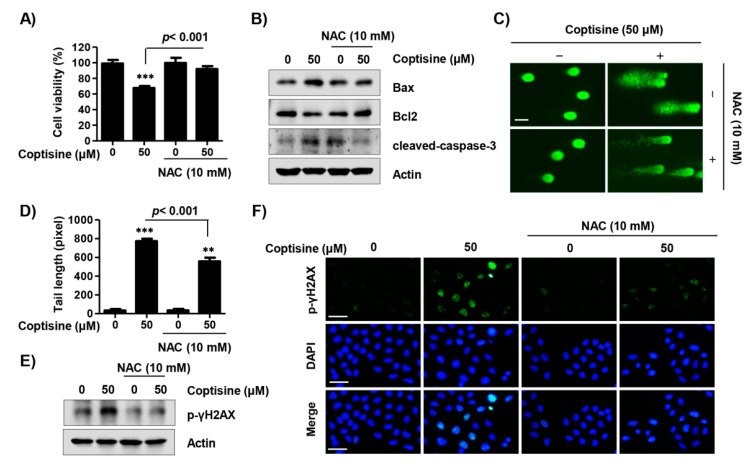
Figure 6.
Induction of apoptotic cell death via ROS production by coptisine in Hep3B cells. Cells were pretreated with or without 10 mM NAC for 1 h followed by coptisine treatment for 24 h. (A) Cell viability was measured by an MTT assay. *** p < 0.001 vs. control; (B) The apoptosis regulatory proteins were detected by Western blot analysis; (C) Comet assay was performed, and representative images were taken by a fluorescence microscope. Scale bars. 50 µm; (D) The statistical analysis of tail length. ** p < 0.01 and *** p < 0.001 vs. control; (E,F) p-γH2AX expression was assessed by Western blot analysis and fluorescence microscopy. DAPI staining was used to visualize nuclei. Scale bars, 30 µm.

