Figure 3.
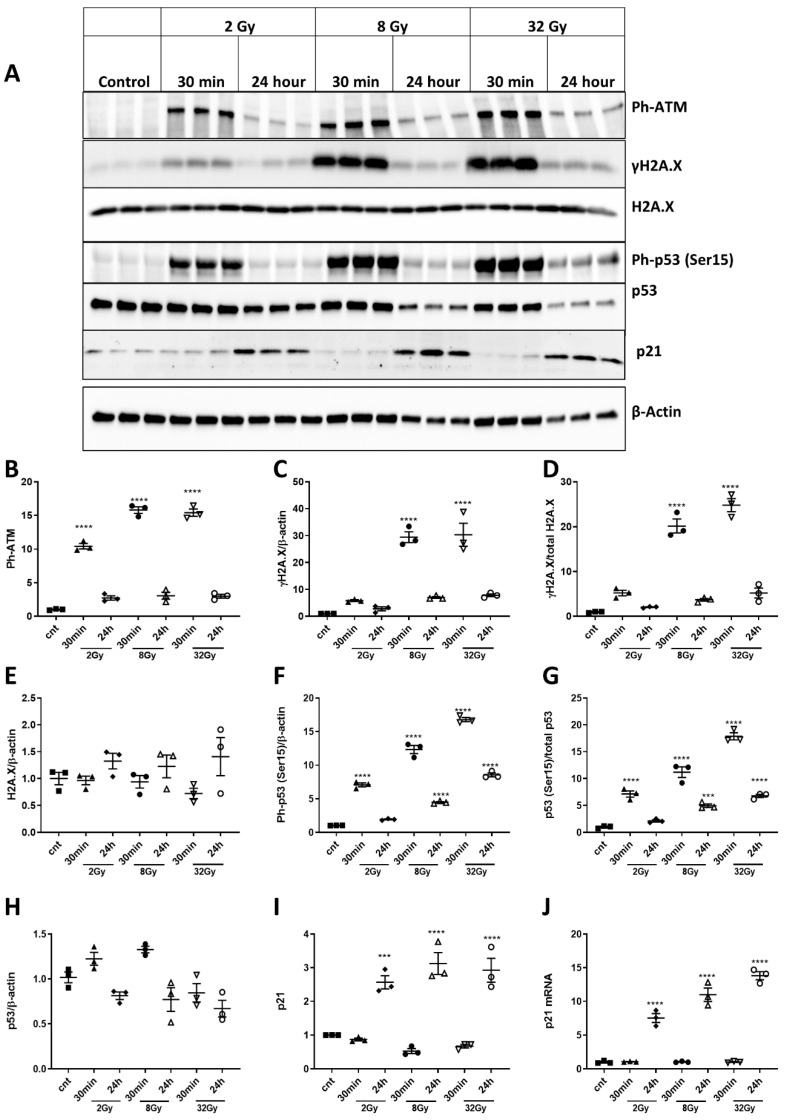
Ionizing radiation (IR) induces rapid and dose-dependent activation of DNA-damage and p53 pathways in primary cortical neurons. (A) Western blots for Ph-ATM(Ser 1981), γ-H2A.X, p53 and p21. (B) Ph-ATM (Ser1981) (F(6,14) = 246.4, p < 0.0001 for 30 min 2, 8 and 32Gy, compared to control; p = 0.0384 for 24 h 8Gy, p = 0.0483 for 24 h 32Gy, compared to control; p < 0.0001 for 24 h groups, compared to 30 min and for 30 min 8Gy, compared to 30 min 2Gy. (C) γ-H2A.X (F(6,14) = 47.02, p < 0.0001 for 30 min 8 and 32Gy compared, to control; p < 0.0001 for 30 min 8Gy compared to 30 min 2Gy). (D) γ-H2A.X normalized to total H2A.X (F 6,14) = 102.2, p < 0.0001 for 30 min 8 and 32Gy, compared to control; p < 0.0001 for 30 min 8Gy, compared to 30 min 2Gy; p = 0.045 for 30 min 32Gy, compared to 30 min 8Gy). (E) H2A.X normalized to β-actin. (F) Ph-p53 (F(6,14) = 351.5, p < 0.0001 for 30 min 2, 8 and 32Gy, and for 24 h 8 and 32Gy; p < 0.0001 for 8Gy compared to 2Gy and 32Gy, compared to 8Gy at 30 min; p = 0.0006 for 24 h 8Gy, compared to 24 h 2Gy; p < 0.0001 for 24 h 32Gy, compared to 24 h 8Gy; p < 0.0001 for 24 h 8Gy and 32Gy, compared to control). (G) Ph-p53 normalized to total p53 (F(6,14) = 114.5, p < 0.0001 for 30 min 2, 8 and 32Gy; p = 0.0007 for 24 h 8Gy, p < 0.0001 for 24 h 32Gy, compared to control; p = 0.0016 for 30 min 8Gy, compared to 30 min 2Gy, p < 0.0001 for 30 min 32Gy, compared to 30 min 8Gy; p = 0.0292 for 24 h 8Gy, compared to 24 h 2Gy). (H) p53 normalized to β-actin. (I) p21 (F(6,14) = 32.95, p = 0.0011 for 24 h 2Gy, p < 0.0001 for 24 h 8Gy and p = 0.0001 for 24 h 32Gy, compared to control). Data presented as fold change to non-irradiated control levels after normalization. n = 3/group; * p < 0.05, ** p < 0.01, *** p < 0.001, **** p < 0.0001 vs. control. (J) Neurons were collected 30 min and 24 h after 2, 8 and 32Gy irradiation. Total RNA was used for qPCR analysis. qPCR quantification of p21 mRNA. (F(6,14) = 17.7, p < 0.0001 for all 24 h time points, compared to control). Data presented as fold change to non-irradiated control group. n = 3/group; **** p < 0.0001 vs. control.

