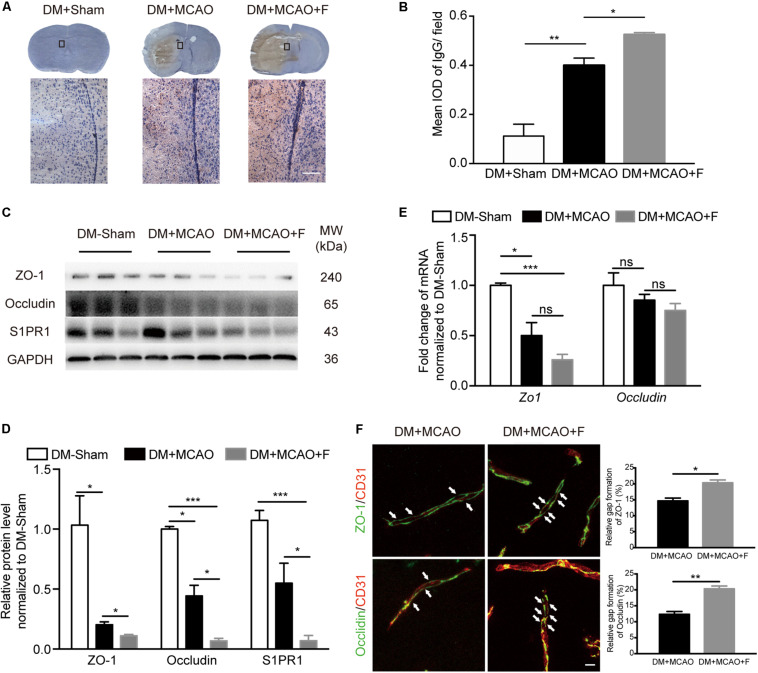
FIGURE 2.
Fingolimod exacerbated blood–brain barrier (BBB) impairment at 24 h after tMCAO. (A), Images of DAB immunostaining against immunoglobulin G (IgG) and H&E staining of coronal sections, the bottom panel shows the higher-magnification images of the boxed areas. Scale bar = 100 μm. (B), Integrated optical density (IOD) quantification of IgG+ signal in the ipsilateral hemisphere at 24 h after tMCAO (n = 4/group). (C,D), Western blot results of ZO-1, Occludin, and Sphingosine-1-phosphate receptor 1 (S1PR1). Quantification of protein levels relative to GAPDH showed in bar chart [n (Sham) = 3, n (DM + MCAO) = 3, n (DM + MCAO + F) = 6]. MW: molecular weight. (E), Bar graph showing relative mRNA expression of Zo1 and Occludin compared with DM-Sham group [n (Sham) = 3, n (DM + MCAO) = 3, n (DM + MCAO + F) = 6]. (F), Micrographs of immunostaining of tight junction proteins, ZO-1 and Occludin, and endothelial marker CD31. Arrows indicating the gaps of these junction proteins on the vessels in the ipsilateral hemispheres. Scale bar, 5 μm. Bar graph showing the relative gap of Zo1 or Occludin formation quantified with the micrographs. [n (DM + MCAO) = 3, n (DM + MCAO + F) = 3]. Data are presented as mean ± SEM, *p < 0.05, **p < 0.01, ***p < 0.001.

