FIGURE 3.
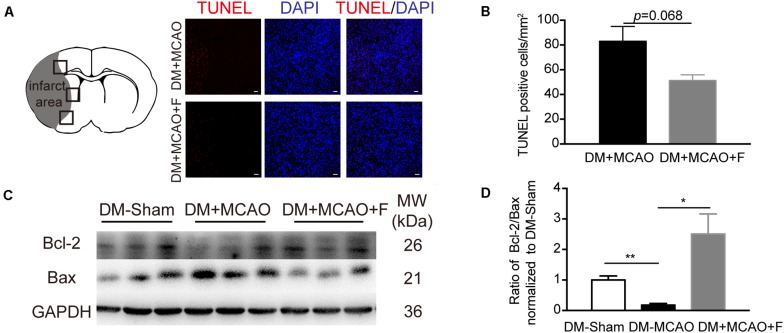
Fingolimod increased Bcl-2/Bax ratio but did not reduce the number of TUNEL + cells at 24 h after tMCAO. (A), Micrographs of TUNEL staining in the peri-infarct region of DM + MCAO and DM + MCAO + F groups. Scale bar, 50 μm. Left panel showing the sketch of the brain section, boxes in it illustrating fields we are sampling in. (B), Bar graph is the quantification of the number of TUNEL+ cells in DM + MCAO and DM + MCAO + F groups (n = 3/group). (C), Western blot results of apoptotic factors Bcl-2 and Bax. (D), Bar graph is the quantification of Bcl-2/Bax ratio based on Western blot data [n (Sham) = 3, n (DM + MCAO) = 3, n (DM + MCAO + F) = 6]. MW, molecular weight. Data are presented as mean ± SEM, *p < 0.05, **p < 0.01.

