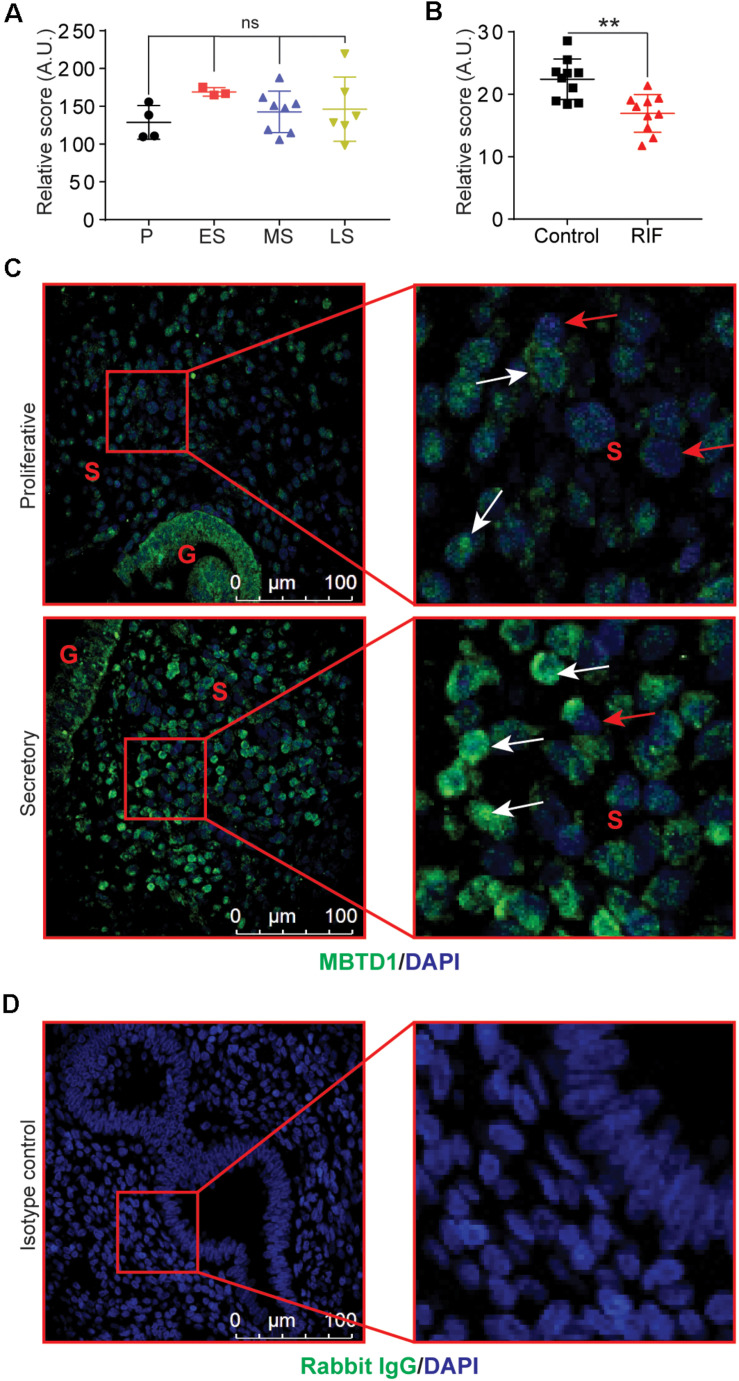
FIGURE 1.
Endometrial expression of MBTD1 throughout the menstrual cycle. (A) MBTD1 raw transcript scores of normal endometrium at various phases of the menstrual cycle, from microarray analysis within a publicly available GEO dataset (GSE4888). Results shown as mean ± SEM (n = 3–7). P, proliferative; ES, early secretory; MS, mid-secretory; and LS, late secretory. (B) MBTD1 raw transcript scores in the mid-secretory phase endometrium from women with and without recurrent implantation failure (RIF) measured from publicly available GEO data set (GSE65102) in patients. Results shown as mean ± SEM (n = 10). (C) Immunolocalization of MBTD1 (green) in proliferative and secretory phase endometrium (n = 9 proliferative and n = 6 secretory) showing increased nuclear localization in stromal cells of secretory phase endometrium. White arrowheads indicate MBTD1-positive cells, and red arrowheads indicate MBTD1-negative cells. Blue stain is DAPI. G, gland; S, stroma. (D) Rabbit IgG was used as isotype control for staining. Scale bar: 100 μm, **P < 0.01 and ns, non-significant.

