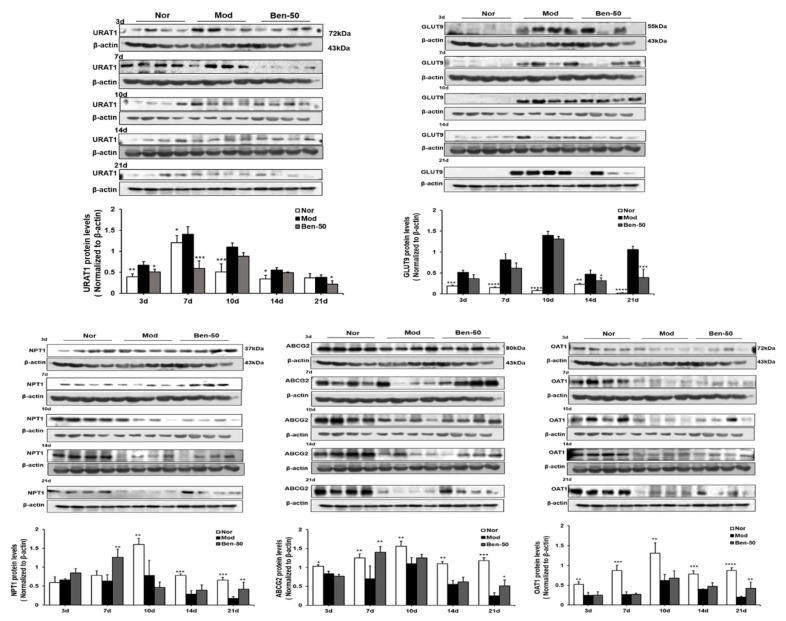
Figure 4.
Renal urate transporters URAT1, GLUT9, OAT1, ABCG2, and NPT1 relative protein expression levels in PO- and adenine-induced hyperuricemia mice. Nor, normal control group; Mod, adenine- and PO-induced hyperuricemia group; Ben-50, positive control benzbromarone group. Values represent the mean ± SD of determinations (n = 12); * p < 0.05, ** p < 0.01, *** p < 0.001, **** p < 0.0001 vs. hyperuricemia group.

