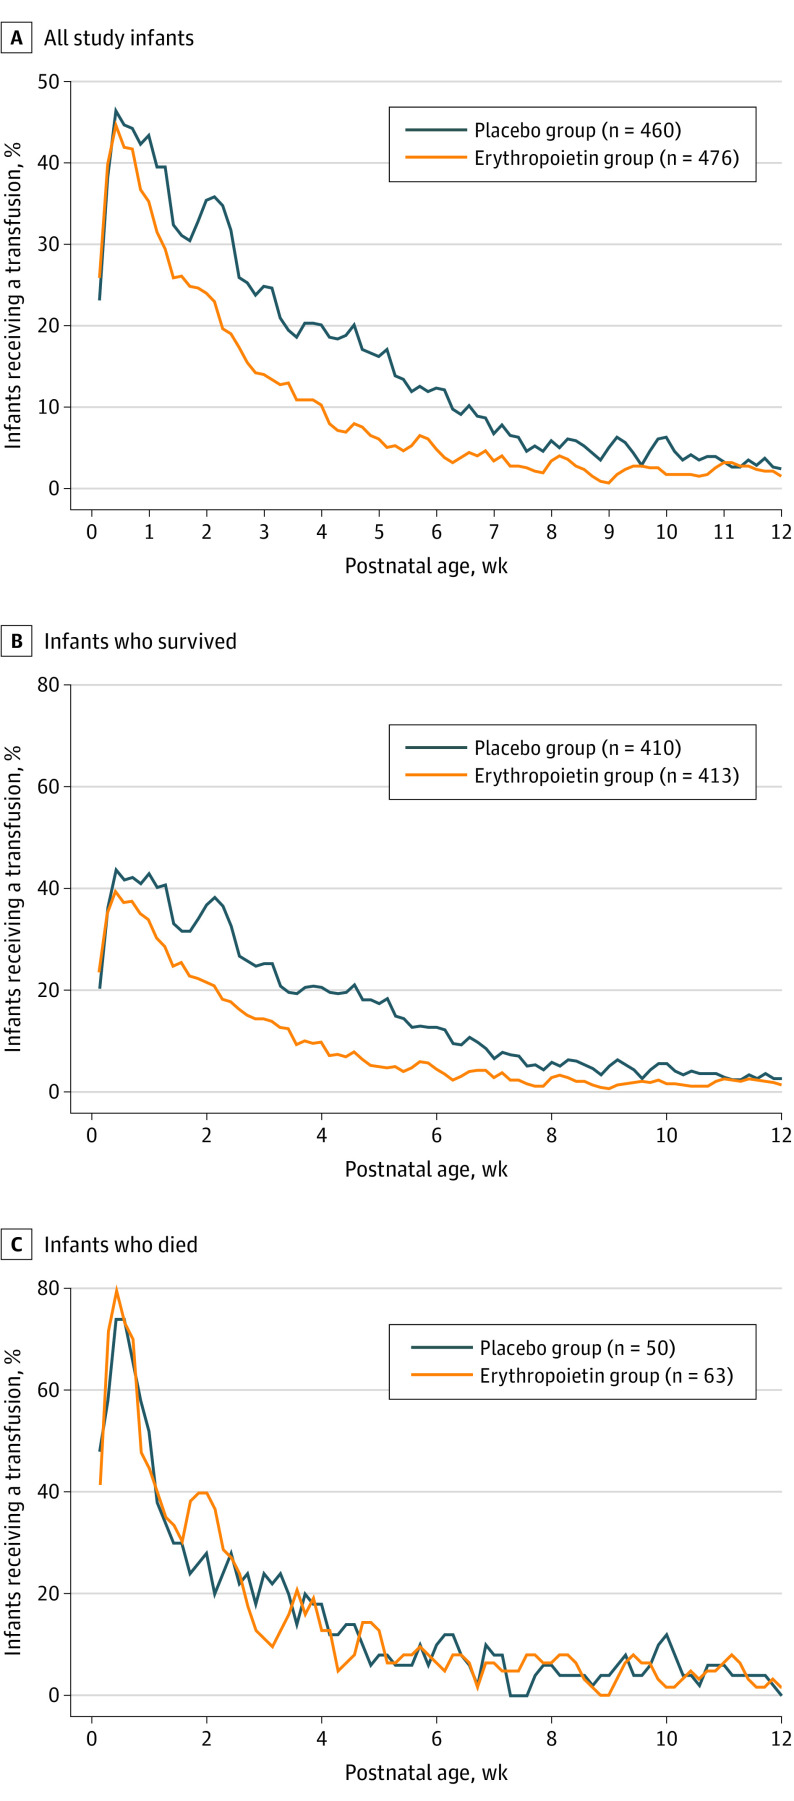
Figure 2. Transfusion Rate by Treatment Group and Survival Status.
Moving 3-day transfusion rates (ie, proportion of infants receiving a transfusion for every 3-day window) by treatment group were calculated for all infants (A [n = 936]), those who survived (B [n = 823]), and those who died (C [n = 113]).

