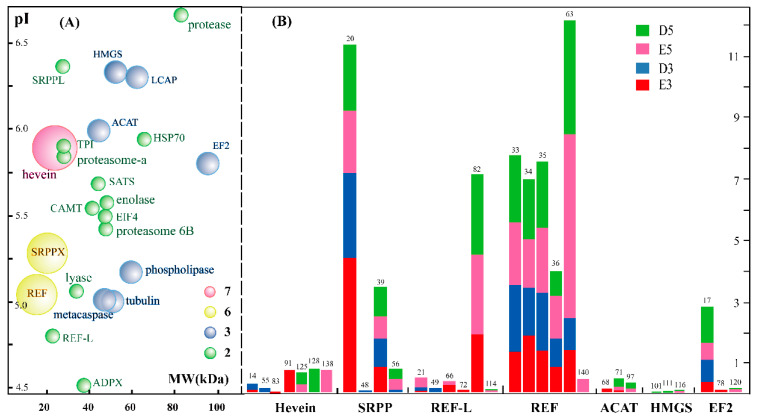
Figure 3.
Bubble diagram of all the protein isoforms and comparison of the changed abundance of 2-DE gels upon ethylene application. The glycosylated proteins with at least two isoforms are highlighted as 23 bubbles from 65 protein spots. The bubbles with different sizes and colors stand for different number of protein isoforms identified from different spots (A). The accumulation patterns of 7 glycoprotein proteins containing 32 isoforms in the 2DE gels for total rubber latex from the rubber tree treated with water and ethylene for three (D3, E3) and five days (D5, E5) are provided (B). The number in the top of the histogram stands for the protein spot number in the 2-DE gels.

