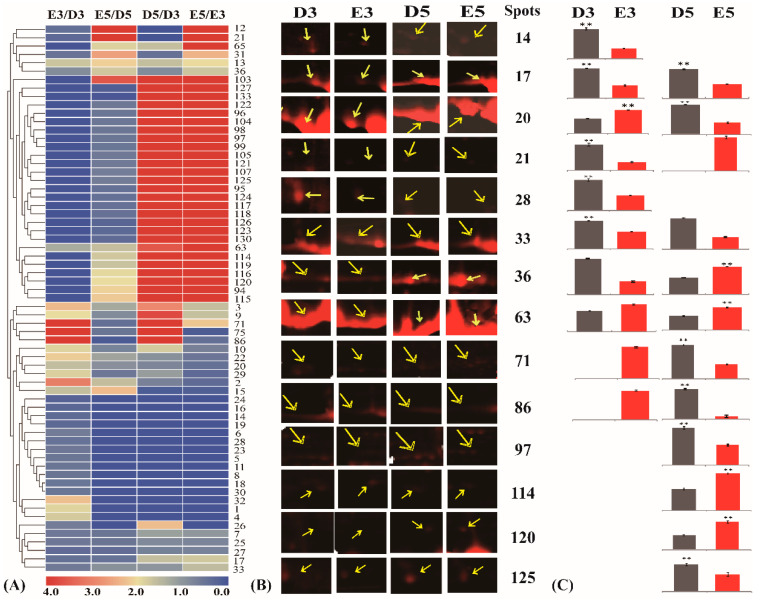
Figure 4.
Changing patterns of differentially accumulated glycoproteins (DAGPs) after application of ethylene. The 65 glycosylated proteins with at least 1.5-fold changes were exposed to hierarchical clustering (A) to show their changed accumulation patterns after being treated with ethylene or water for three (E3/D3) or five (E5/D5) days. The changed ratios of these proteins after treating with water or ethylene for different times (D5/D3; E5/E3) are also presented. The up- or down-regulated proteins are indicated in red or green, respectively. The intensity of the colors increased with the increased accumulation, as shown in the bar at the bottom. The spot numbers are indicated in the heat plot, which includes five based areas from the top to bottom. The accumulation profiles (B) of 14 typical DAGPs in the 2-DE gels and their relatively changed ratios (C) are highlighted. The exact position of each protein spot was correspondingly presented in the four 2-DE gel areas.

