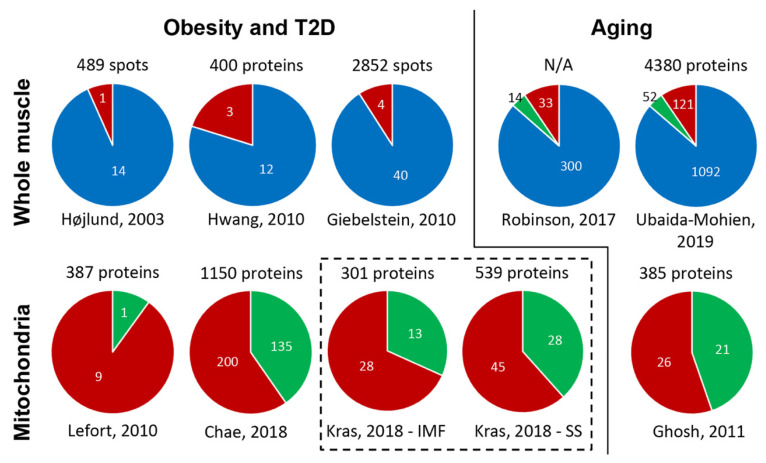
Figure 3.
Altered mitochondrial proteome in skeletal muscle in obesity, T2D, and aging. The pie charts show the total number of protein spots or proteins quantified in whole muscle or the total number of mitochondrial proteins quantified in isolated mitochondria (top), and the number of regulated non-mitochondrial (blue) proteins and downregulated (red) or upregulated (green) mitochondrial proteins identified in relation to obesity, T2D, or aging in proteomic studies of human skeletal muscle (whole muscle or isolated mitochondria) published (first author, year of publication). The pie charts in the box with dotted lines represent a study of both intermyofibrillar (IMF) and subsarcolemmal (SS) muscle mitochondria. N/A, not available.

