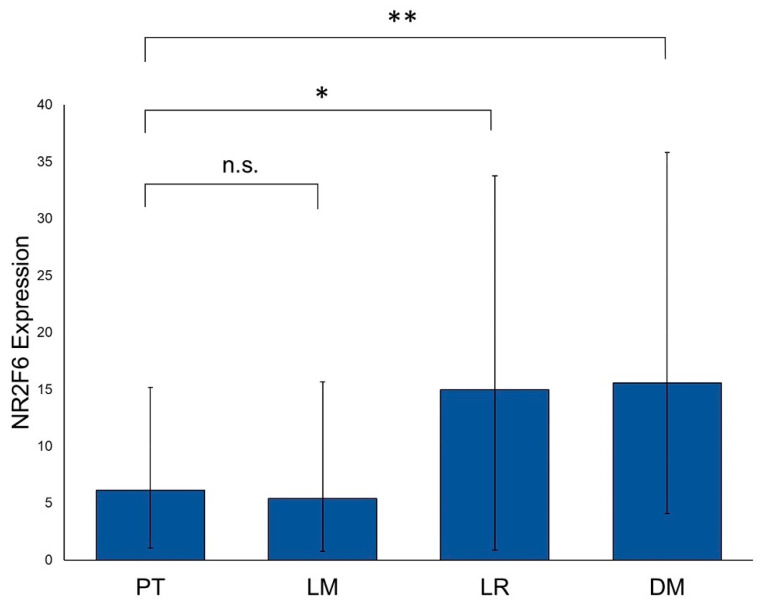
Figure 2.
NR2F6 expression in primary tumors, metastases, and local recurrences. HNSCC tissue samples of PTs (n = 330), LMs (n = 127), LRs (n = 62), and DMs (n = 21) were assessed for their NR2F6 expression levels. NR2F6 expression in PTs is significantly lower than in LRs (Mann–Whitney test, p = 0.014) and DMs (Mann–Whitney test, p = 0.005). (* p ≤ 0.05; ** p ≤ 0.01; n.s. = not significant).

