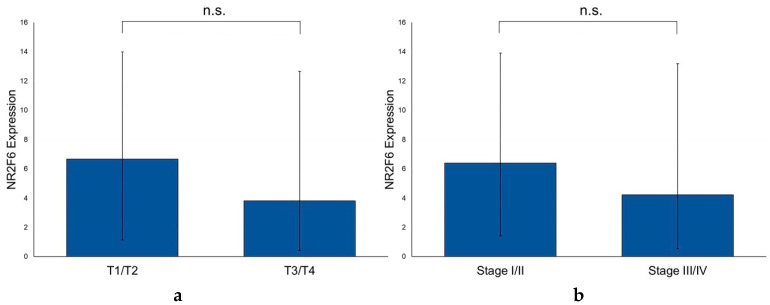
Figure 7.
Differences in the NR2F6 expression of different T stages and UICC stages of HNSCC PTs. (a) The NR2F6 expression in PTs did not correlate with the T stage (Mann–Whitney test, p = 0.718). (b) The NR2F6 expression in PTs did not correlate with the UICC stage (Mann–Whitney test, p = 0.474). (n.s. = not significant).

