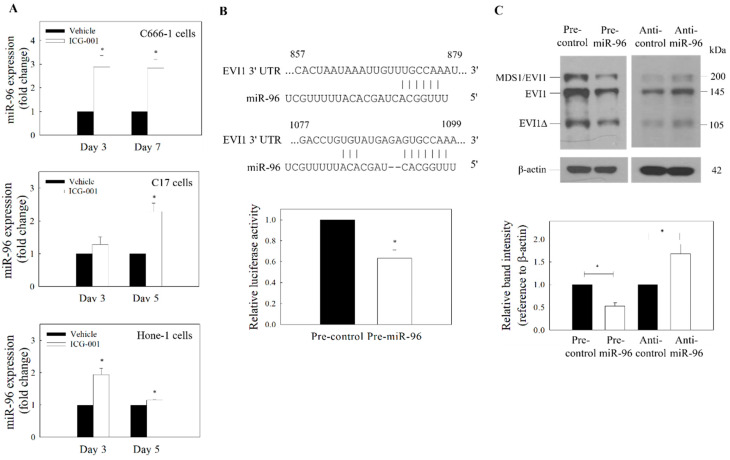
Figure 3.
Expression of miR-96 and EVI1. (A) qRT-PCR analysis of ICG-001-induced expression of miR-96. ICG-001 upregulates the expression of miR-96 in the EBV-positive (C666-1 and C17) and EBV-negative (Hone-1) cells. (B) Putative binding site of miR-96 on EVI1 mRNA 3′-UTR was predicted using TargetScan (upper panel). The EVI1 3′UTR luciferase reporter assay (lower panel) was performed in C666-1 cells. (C) Effect of miR-96 on the expression of EVI1. C666-1 cells were transfected with pre-miR-96 or anti-miR-96. Upper panel: Protein blot. Lower panel: Quantitative analysis of EVI1 expression from the protein blot. Values are presented as the mean ± SD of at least three independent experiments. * p < 0.05 compared with the corresponding control.

