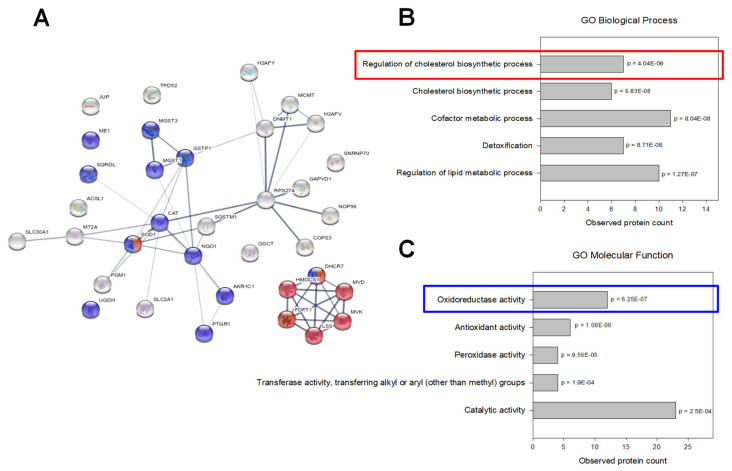
Figure 5.
Proteomic data analysis: (A) Interaction network of regulated proteins (generated by STRING v11.0). The connecting lines between protein nodes represent protein-protein interactions and the thickness of the edge indicates interaction score (minimum interaction score = 0.4). Coloring of proteins is based on further enrichment analysis. Proteins marked in red are involved in regulation of the cholesterol biosynthetic process. Proteins associated with oxidoreductase activity are marked in blue. (B,C) Enrichment analysis of regulated proteins (performed in STRING v11.0). Graphs are showing the most enriched Gene Ontology (GO) Biological Processes (B) and Molecular Functions (C) among the regulated proteins with observed protein count in each category and calculated p values corrected for multiple testing (Benjamini and Hochberg).

