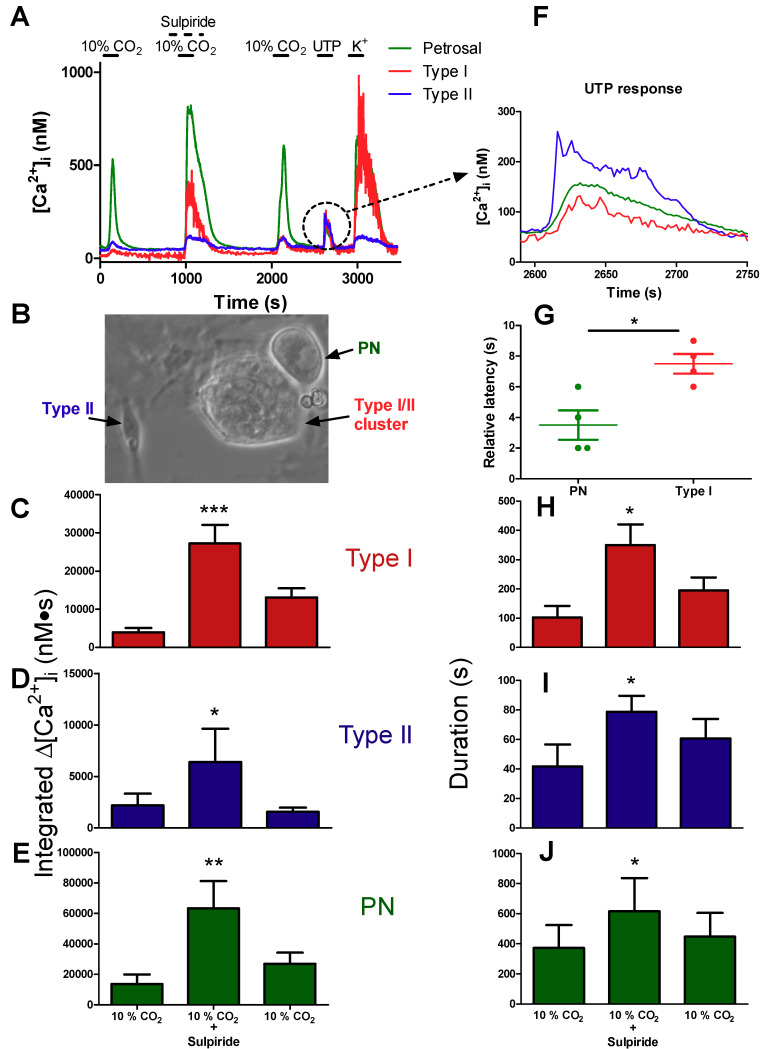
Figure 5.
Sulpiride enhances hypercapnia-evoked responses in type I cells, type II cells, and petrosal neurons during simultaneous Ca2+ imaging in functional cocultures. (A) Representative traces showing the [Ca2+]i responses in a type I cell (red), type II cell (blue), and petrosal neuron (green), recorded simultaneously during hypercapnia (10% CO2) in a carotid body coculture. (B) Typical phase contrast micrograph of a coculture showing a petrosal neuron (PN) adjacent to a type I/type II cell cluster; a solitary, isolated type II cell with its characteristic elongated shape is also shown (left). In A, note the marked potentiation of the hypercapnic responses in all 3 cell types when sulpiride was present, as well as the responses of the 3 cells to UTP. The UTP-evoked responses (dotted circle in A) are enlarged in (F) to reveal differences in response latency. Summary data of response latency (sec) of PN and type I cells relative to that in type II cell are shown in (G); note PN responses precede those in type I cells during direct stimulation of type II cells with UTP (*p < 0.05; n = 4 separate cultures). Histograms (C–E,H–J) show integrated [Ca2+]i response (nM∙s) and mean duration of the [Ca2+]i response during hypercapnia in type I cells (C,H), type II cells (D,I), and PN (E,J); n = 3 separate cultures/group. Data were analysed using a one-way repeated measures analysis of variance (ANOVA) followed by Tukey’s post hoc test; (*, **, and *** signifies a p value of < 0.05, 0.01 and 0.001, respectively. Values are means ± S.E.M.).

