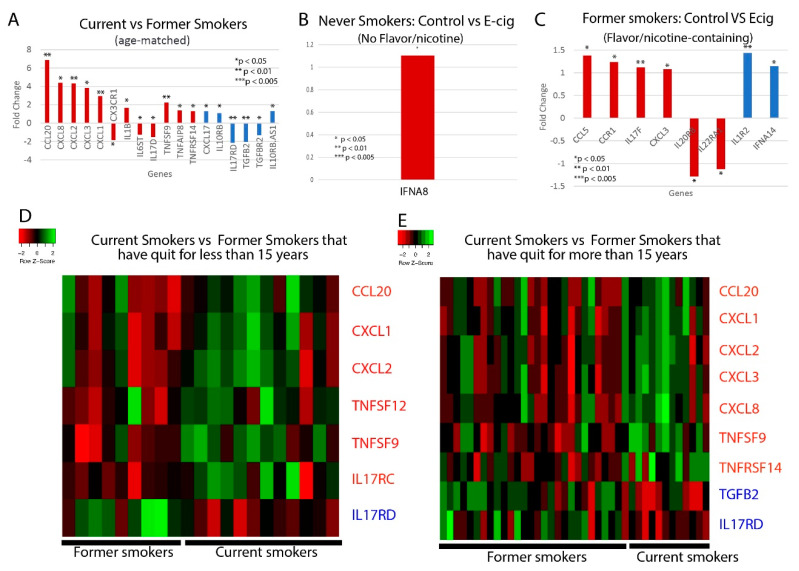
Figure 2.
Cytokine-related gene expression. Bar plots of the fold changed of significantly dysregulated cytokine genes in (A) current vs. former smokers; and control vs. e-cig users that have used e-cigs with (B) no flavors or nicotine or (C) with nicotine and/or flavors. Heat maps illustrating differences in cytokine gene expression between current smoker and former smokers that have either quit for (D) less than 15 years or (E) more than 15 years. Heat maps are split into quadrants based on current/former smokers and pro/anti-inflammatory cytokines. Red bar plots represent proinflammatory cytokines, and blue bar plots represent anti-inflammatory cytokines.

