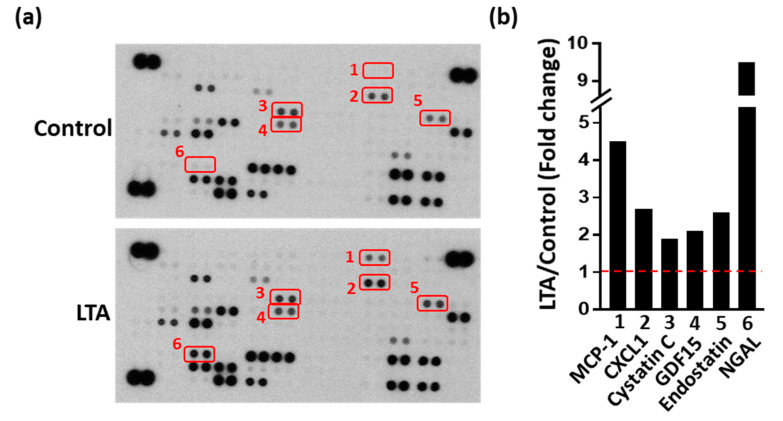
Figure 4.
Different protein expression patterns in the culture medium from osteoblastic cells from different groups, as determined by protein-array measurements. (a) The expression levels of cytokines, chemokines and soluble factors were measured for each group using protein-array assays. (b) Spots with high-intensity changes were measured with the Image J software. The fold-change reflects the expression observed in the LTA group divided by that in the control group. Abbreviations: MCP-1, monocyte chemoattractant protein 1; CXCL1, chemokine (C-X-C motif) ligand 1; GDF15, growth differentiation factor-15; NGAL, neutrophil gelatinase-associated lipocalin. Red box represents two repetitions. Red line represents the basal level (control group).

