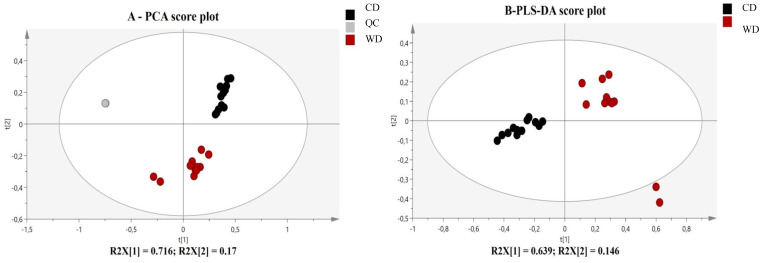
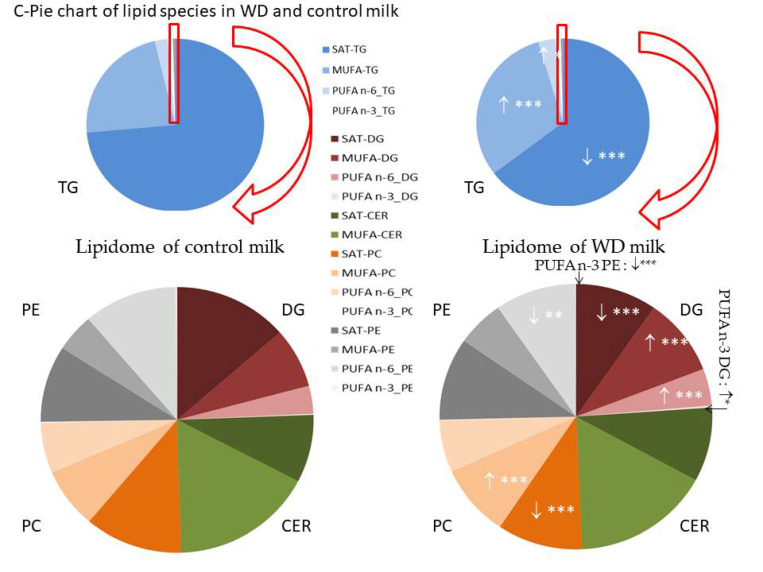
Figure 5.
(A) PCA analysis reveals an influence of maternal high caloric diet during gestation and lactation on milk lipidome. PCA score plot on the two first dimensions of the PCA, accounting for 89% of the total variance for 3955 data points (features m/z acquired in LC- ESI+-HRMS), reveals natural clusters for milk provided by WD-(red) and C-(black) fed dams or QC samples (grey) at day 20 of lactation. (B) Score plots from PLS-DA classification between WD- and C-milk. (C) Pie chart showing the composition of the lipidome of breast milk from WD- and C-dams. The red box has been enlarged to visualize the distribution of diglycerides and phospholipids that are minors compared to triglycerides in breast milk. Values of p-values (assessed by Mann–Whitney U test) between “western diet” and “control diet” groups were reported with *, ** or ***, significantly different; p < 0.05, p < 0.01 or p < 0.0001, respectively. Concentrations (expressed in µM) of lipids ↑ increased and ↓ decreased in WD milk versus control milk.


