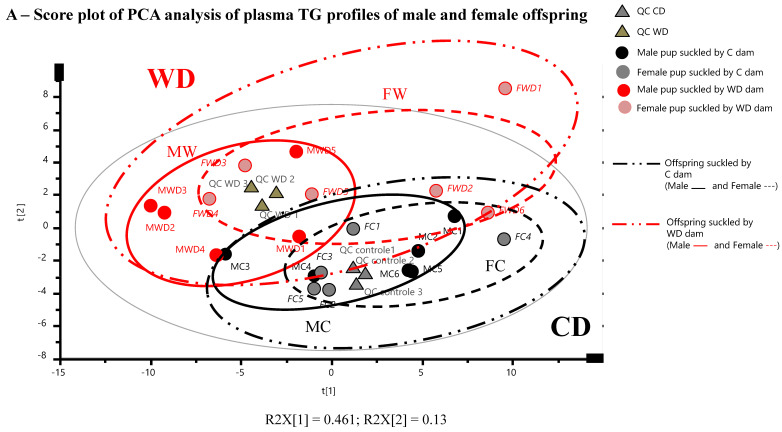
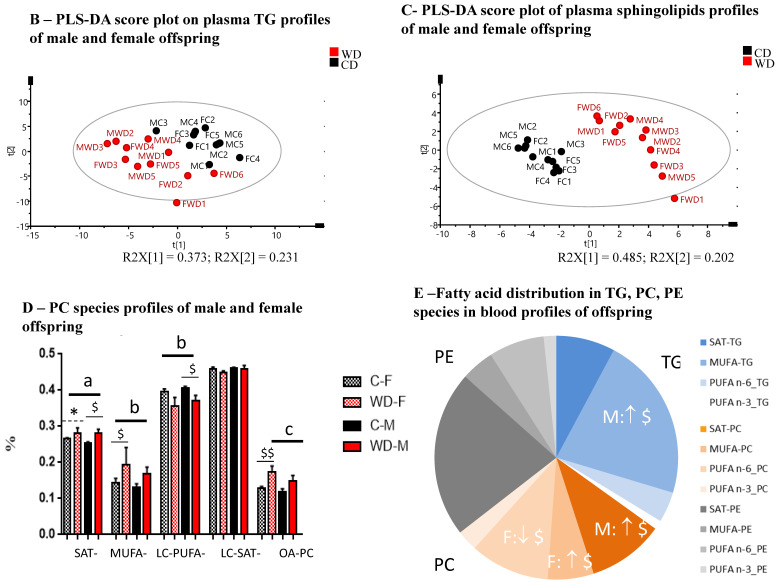
Figure 6.
(A) PCA analysis reveals an influence of maternal diet during gestation and lactation on male and female offspring blood lipidome at day 25 of lactation period. PCA score plot on the two first dimensions of the PCA, accounting for 59% of the total variance for 62 data points (TGs), reveals natural clusters for all the male (MC, MWD) and female (FC, FWD) offspring and according to maternal diet (C, WD). The PCA model presented a cumulative modeled variation (R2X) value of 95% and 92% and a cumulative predicted variation (Q2Y) value of 83% and 14% for maternal diet and offspring sex groups, respectively, for 22 data points (Cer-SM), indicating good agreement. Score plots from PLS-DA classification of offspring blood TGs (B) and sphingolipids (C) species according to maternal diet (C, WD). Only one sample (FWD1) was identified as outlier according to the Hotelling’s T2 grey circle, corresponding to a multivariate generalization of the 95% confidence interval. (D,E) Fatty acids distribution in phosphatidylcholines (PC species), phosphoethanolamines (PE species) and triglycerides (TG species) in blood of male and female offspring of both WD and C groups (data of sphingolipids were detailed in Table 3). Values were mean ± SEM (D) or mean (E). For each biomarker, values of p-values (assessed by Mann–Whitney U test) between “western diet” and “control diet” groups, regardless of sex group, were reported with a, b, c significantly different; p < 0.05, p < 0.01 or p < 0.001, respectively. Values of p-values (assessed by Mann–Whitney U test) between “female” and “male” groups considering each diet group, were reported with *, p < 0.05 significantly different. Values of p-values (assessed by Mann–Whitney U test) between “western diet” and “control diet” groups considering each sex group were reported with $, p < 0.05 and $$ p < 0.01 significantly different. SAT: saturated fatty acids (C8:0 to C14:0); MUFA: Monounsaturated fatty acid; LC-SAT: Long-chain saturated fatty acids (that contains at least 16 carbons); LC-PUFA: Long-chain PUFA (polyunsaturated fatty acid that contains at least 16 carbons).


