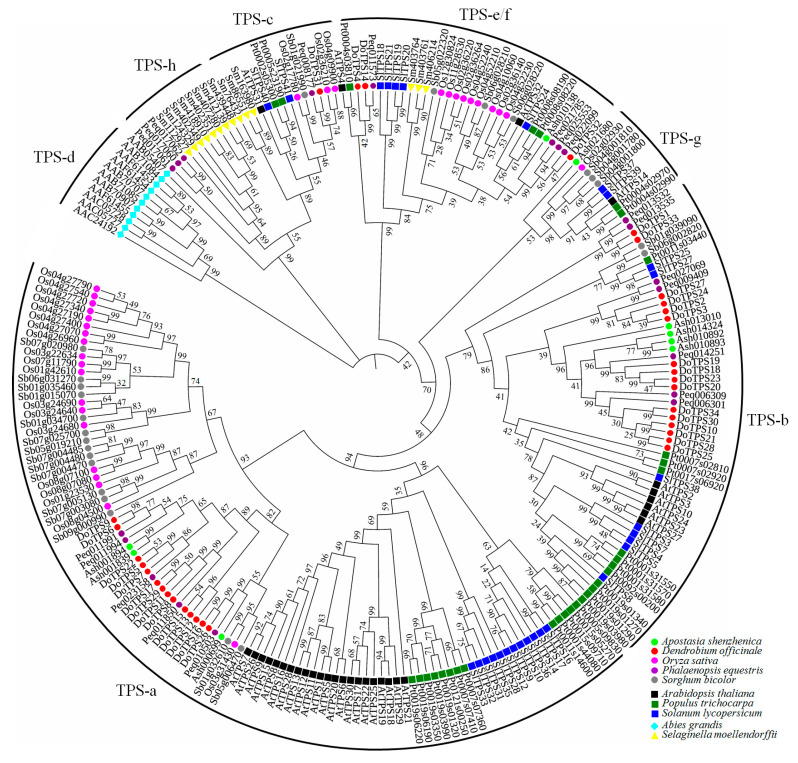
Figure 3.
Phylogenetic analysis of TPS proteins in ten higher plant species. A phylogenetic tree was constructed by the neighbor-joining method with the Jones–Taylor–Thornton model and pairwise deletion option using MEGA 7.0 with 1000 bootstrap replicates. Tree visualization and labeling was performed on FigTree v1.4.4 (http://tree.bio.ed.ac.uk/software/figtree/). The TPS family was divided into seven subfamilies as previously reported [1,15]: TPS-a, TPS-b, TPS-c, TPS-d, TPS-e/f, TPS-g, and TPS-h. Circles represented monocotyledonous plants, squares represented dicotyledonous plants, the cyan diamond indicates Abies grandis, and yellow triangle indicates Selaginella moellendorffii.

