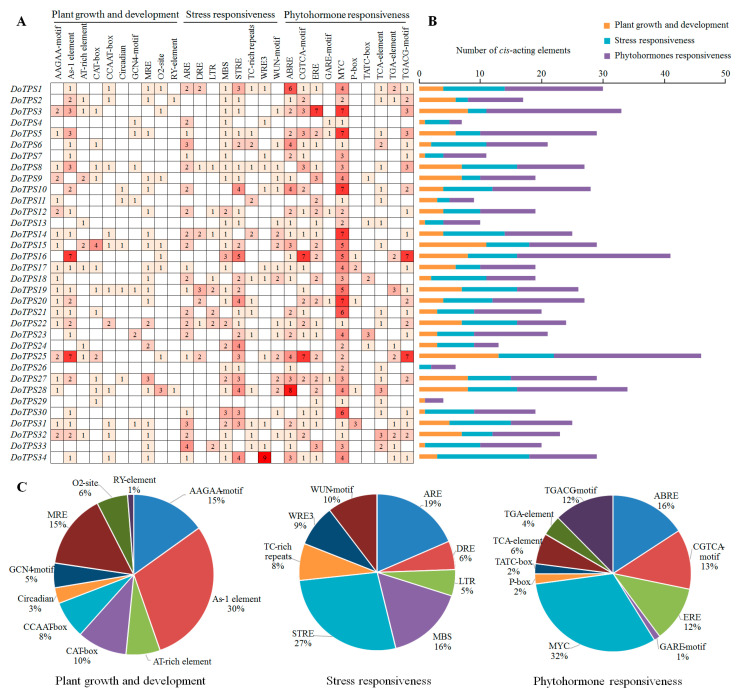
Figure 5.
Information of cis-acting elements in DoTPS genes of D. officinale. (A) The gradient red colors and numbers in the grid indicate the number of different cis-acting elements in DoTPS genes. (B) The different colored histogram indicates the number of cis-acting elements in each category. (C) The ratio of different cis-acting elements in each category is shown as pie charts.

