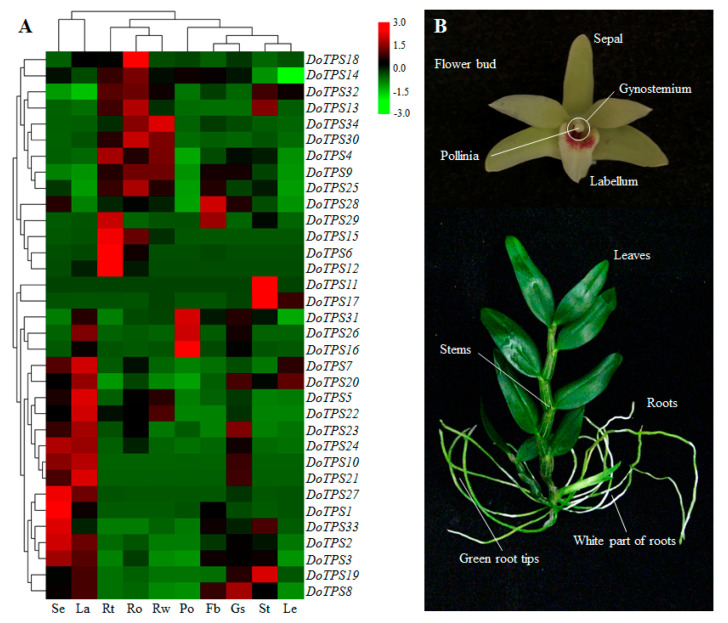
Figure 6.
Tissue-specific expression profiles of DoTPS genes in different D. officinale organs. (A) The transcription levels of DoTPS genes in different tissues. The different tissues were sepals (Se), labellum (la), green root tips (Rt), roots (Ro), white part of roots (Rw), pollinia (Po), flower buds (Fb), gynostemium (Gs), stems (St), and leaves (Le) in two-year-old D. officinale adult plants. Heatmap was generated using the TBtools server (https://github.com/CJ-Chen/TBtools), and gradient color from green to red was expressed as the log2-transformed expression levels of each DoTPS gene that was normalized to the internal reference gene DoEF-1α, GenBank accession no. JF825419. (B) D. officinale “Zhongke 5” used in this study. All fragments per kilobase of transcript per million fragments mapped (FPKM) values that were used were downloaded from NCBI under BioProject PRJNA262478 [25], and are listed in Table S7.

