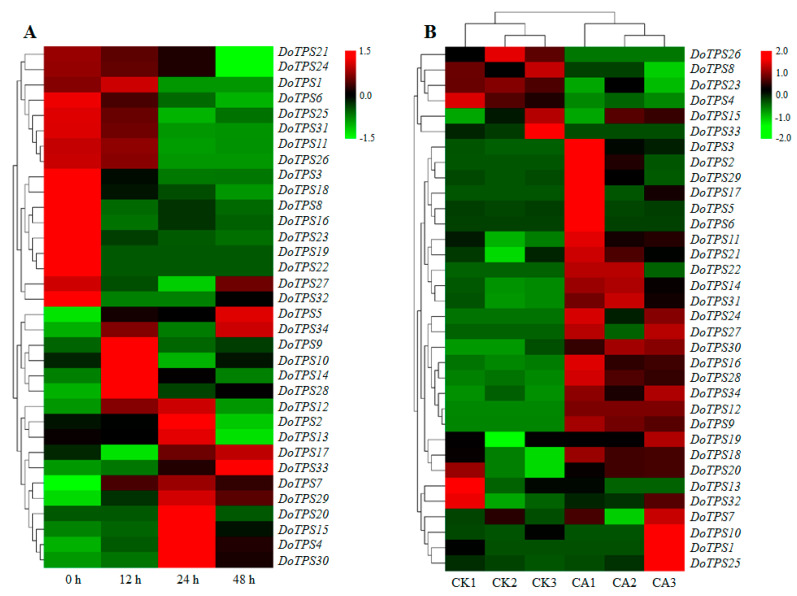
Figure 7.
Transcription levels of DoTPS genes in D. officinale under cold and osmotic stresses. (A) Expression profiles of DoTPS genes in response to 200 mM mannitol treatment for 48 h. (B) Expression profiles of DoTPS genes in response to cold treatment (0 °C) for 20 h. Heatmap was drawn using TBtools software (https://github.com/CJ-Chen/TBtools). Color gradient from green to red was expressed as the log2-transformed expression level of each DoTPS gene. CA, cold acclimation; CK, control (non-acclimation). The expression values of DoTPS genes in response to mannitol treatment are listed in Table S8. The FPKM values of DoTPS genes exposed to cold treatment that were downloaded from a transcriptome database [29], are listed in Table S9.

