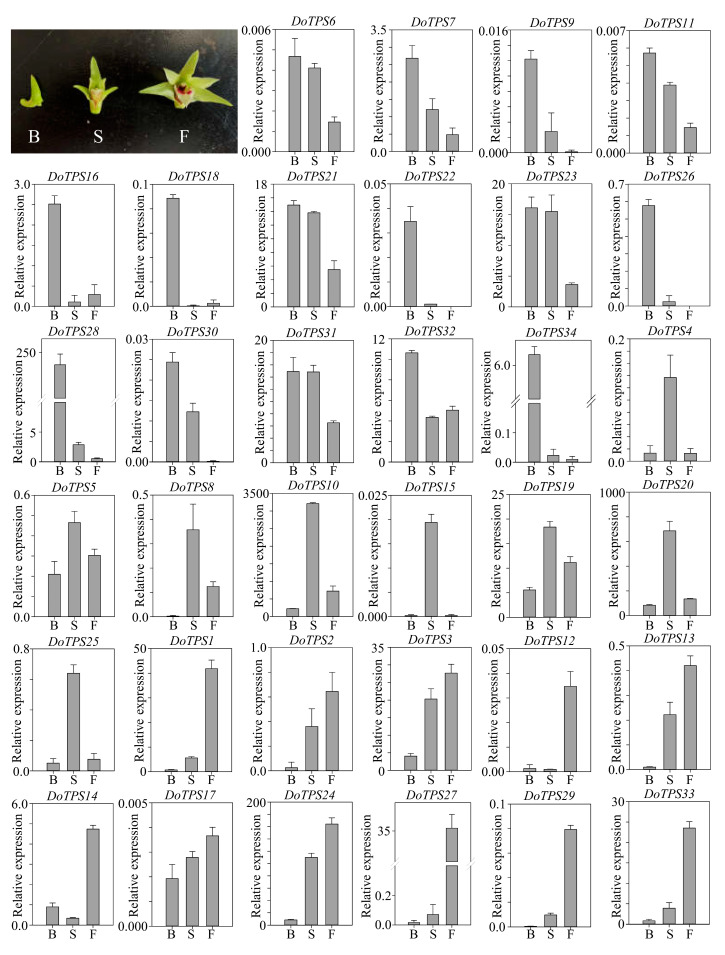
Figure 9.
Transcription levels of DoTPS genes in D. officinale at three flowering stages: budding (B), semi-flowering (S) and full flowering (F). The levels of transcription were calculated by the 2−ΔΔCT method and normalized to the CT value of DoEF-1α. Each bar represents the mean (±standard error, n = 3) of three independent biological replicates. Different letters above bars indicate significant differences (p < 0.05, Duncan’s multiple range test). The expression values of DoTPS genes at three flowering stages of D. officinale are listed in Table S11.

