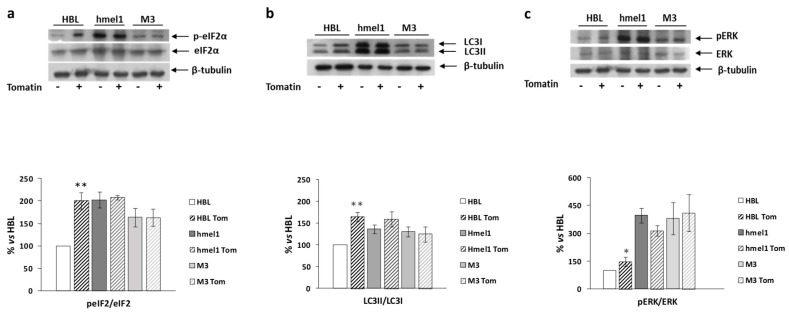
Figure 4.
The effect of tomatine on the activation/expression levels of p-eIF2α and LC3 II/I, respectively, and on ERK phosphorylation levels in hmel-1 and M3 cells compared to BRAFwt HBL cells. (a) Representative Western blot of eIF2α and p-eIF2α levels, performed on whole cell lysates. Bar graph shows the p-eIF2α/eIF2α ratio calculated by densitometric analysis of the protein bands, normalized to tubulin, used as loading control. (b) Representative Western blot of LC3-I and LC3-II levels, performed on whole cell lysates. Bar graph shows the LC-II/LC-I ratio calculated by densitometric analysis of the protein bands, normalized to tubulin, used as loading control. (c) Representative Western blot analyses of pERK and ERK levels on whole cell lysates. Bar graph shows the pERK/ERK ratio, calculated by densitometric analysis of the protein bands, normalized to tubulin, used as loading control. Values are the mean ± SEM of three independent experiments, expressed as a percentage of the HBL value. Significance was calculated with Student’s test; * p < 0.05, ** p < 0.005 vs. vehicle-treated cells.

