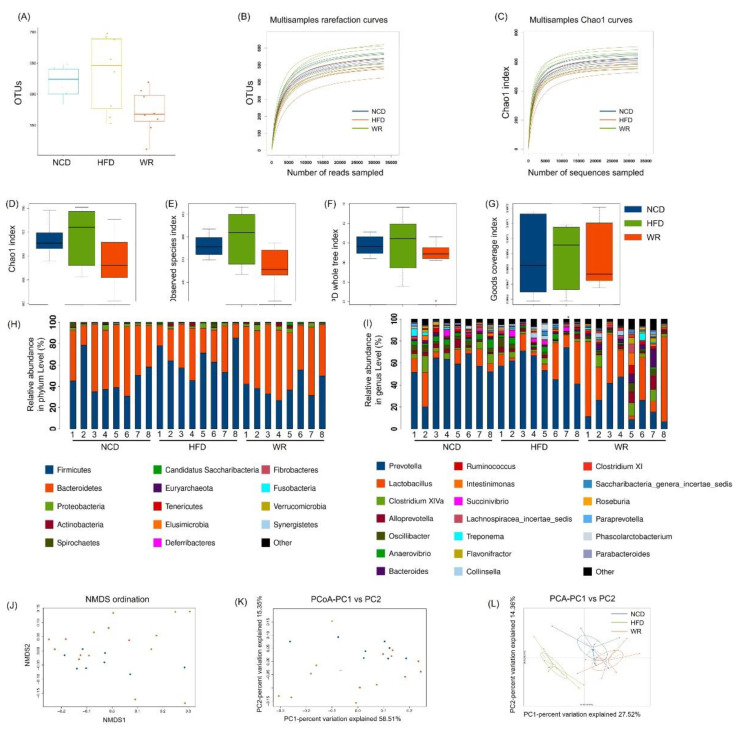
Figure 3.
Comparison of the alpha diversities, species richness, and structures of the gut microbiota between wild rice and HFE-fed mice. (A) The numbers of OTUs. (B) Rarefaction curves and (C) Chao1 curves. (D–G) Index of the Chao1 index, observed species, phylogenetic diversity (PD) whole tree, and goods coverage of each group, respectively. All of the values are presented as mean ± SE (n = 5). Relative abundances at the level of the (H) phylum and (I) genus level. (J–L) NMDS, PCoA, and PCA of each sample. NCD presents normal chow diet group. HFD presents high-fat diet group. WR presents wild rice diet group, respectively.

