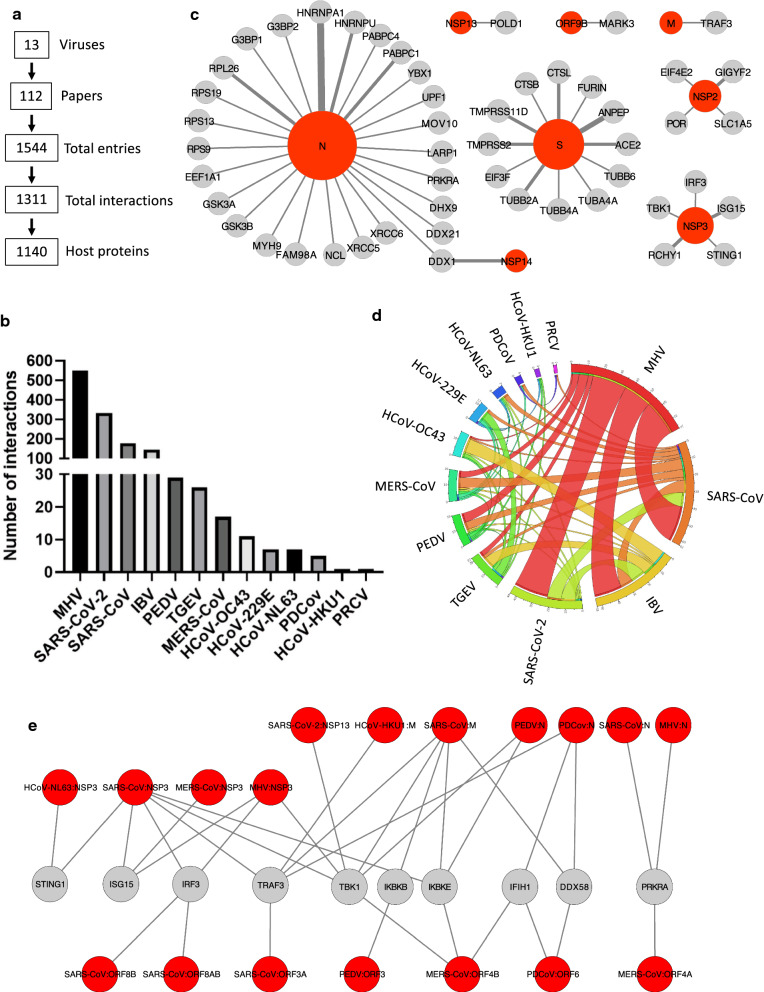
Fig. 1.
Quantitative analysis of collected virus host-interactions. a Key numbers describing the database that has been assembled. b Numbers of distinct interactions that have been collected for each virus. c Orthologous interactions conserved between several viruses. The thickness of the lines is proportional to the number of viruses for which the interaction was reported. Displayed graph was generated using Cytoscape [79]. d Circular diagram showing the proportion of shared host protein targets between analyzed coronaviruses. Display was obtained using the Circos table viewer [80]. e Innate immunity factors interacting with several coronavirus proteins

