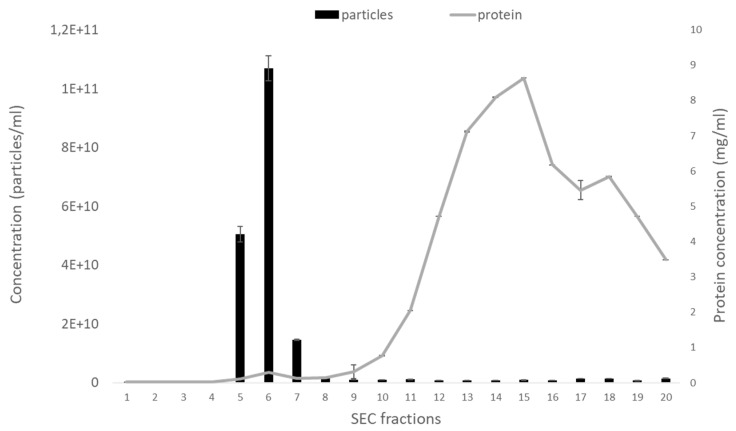
Figure 1.
The concentration of extracellular vesicles (EVs) and protein in fractions isolated by size-exclusion chromatography (SEC). Fractions 5–7 contain the highest number of EVs while maintaining relatively low protein contamination. n = 3, error bars represent the standard error of the mean (±SEM). EV concentration was analyzed using ZetaView® nanoparticle tracking analyzer (NTA), and the protein concentration was measured using Quick Start™ Bradford Protein Assay.

