Figure 2.
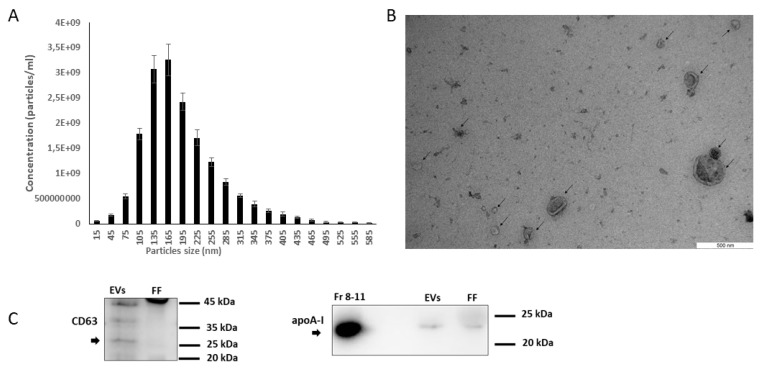
Characterization of follicular fluid derived EVs. (A) The size profile of EVs measured by ZetaView® nanoparticle tracking analyzer (NTA), n = 3, error bars represent the standard error of the mean (±SEM). (B) EVs purified from follicular fluid were analyzed by transmission electron microscopy, where the black arrow points towards the presence of EVs. EVs samples were observed with a JEM 1400 transmission electron microscope at 80 kV, and digital images were acquired with a numeric camera (Morada TEM CCD camera, Olympus, Germany). (C) EVs purified from follicular fluid showed a positive signal for EV specific marker CD63 and this particular EV marker was absent in follicular fluid (FF). This comparison showed CD63 as an EV marker was enriched in our samples of EV compared to original FF samples used as control. apoA-I marker was used as a purity control for EVs, and a strong signal of apoA-I was observed in both protein fractions (8–11) and unpurified FF samples compared to the EVs fractions (5–7), which indicates that EVs purified from FF by SEC had little or no contamination. Protein bands were detected using ECL SelectTM Western Blotting Detection Reagent with ImageQuantTM RT ECL Imager.

