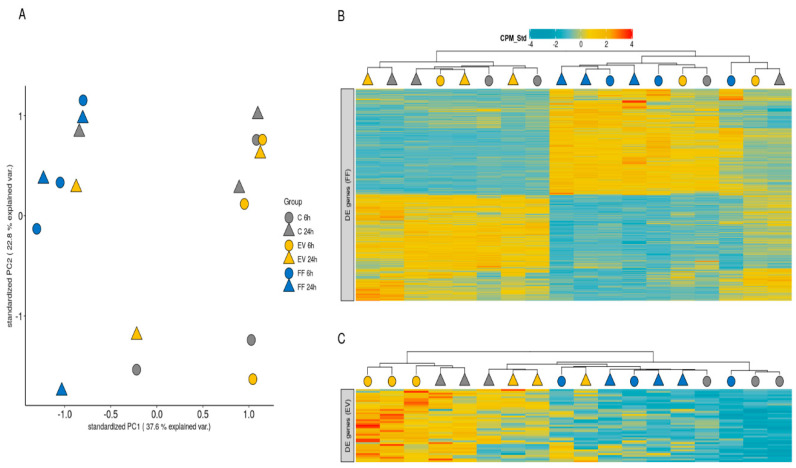
Figure 4.
(A) Principal Component Analysis (PCA) of standardized (z-score) counts per million (CPM) values of all the expressed genes in the cultured bovine oviductal epithelial cells (BOECs) under control conditions and following supplementation with follicular fluid (FF) or follicular fluid-derived extracellular vesicles (EV). Samples were collected either 6 h or 24 h after supplementation. (B) Heatmap of standardized (z-score) CPM values of genes that were differentially expressed either 6 h or 24 h following FF supplementation and hierarchical clustering of samples based on these values. (C) Heatmap of standardized (z-score) CPM values of genes that were differentially expressed either 6 h or 24 h following FF EVs supplementation and hierarchical clustering of samples based on these values.

