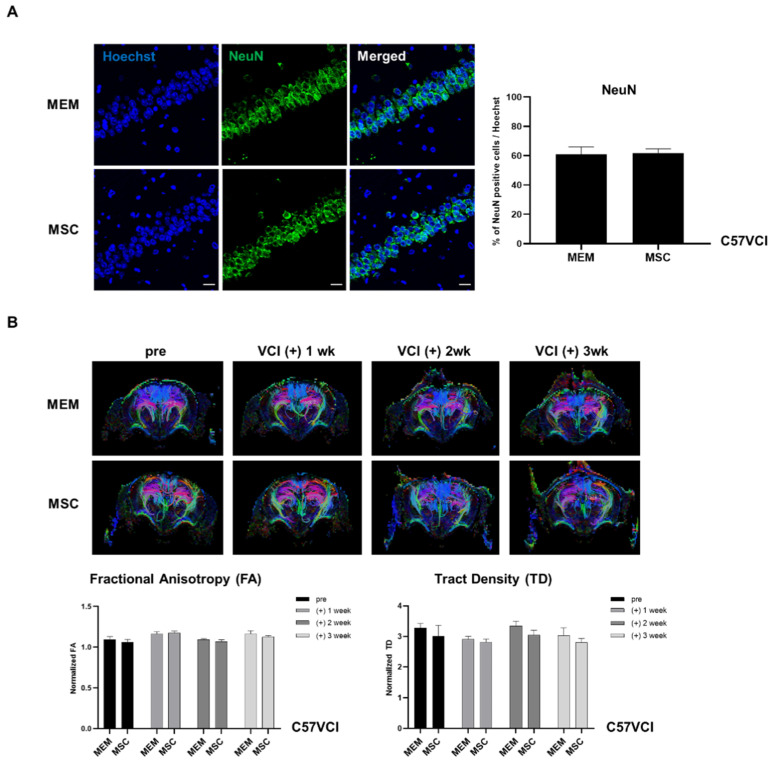
Figure 4.
Evaluation of changes in neuronal density and white matter tracts after MSC injection. (A) IHC stains displaying expressions of hippocampal neuronal cells (green) using the mature neuron marker, NeuN, in both the MEM (n = 5) and MSC (n = 6) groups. Scale bar = 20 µm. (B) Directional color-coded fractional anisotropy (FA) maps (acquired at varying time points: pre, post 1 week: (+) 1 wk, post 2 week: (+) 2 wk, and post 3 week: (+) 3 wk) exhibiting the tractography of representative animals from the MEM and MSC groups. Selective DTI parameters: FA and tract density (TD) are normalized by dividing the value of the corpus callosum from the value of the whole brain.

