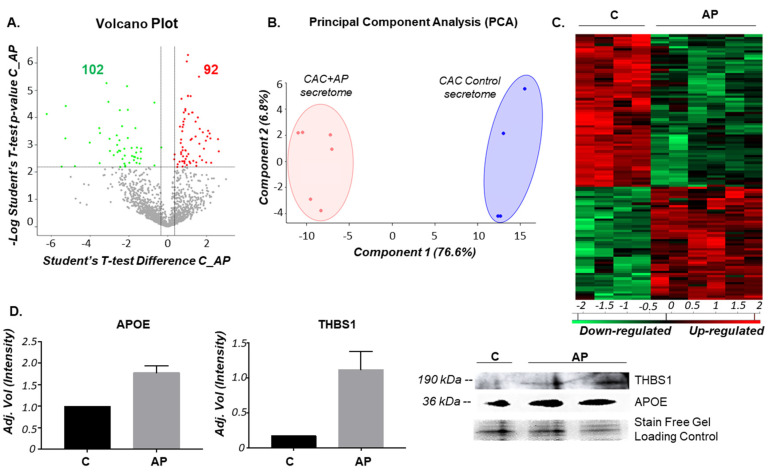
Figure 1.
Differential secretion protein profile of circulating angiogenic cells (CAC) in presence/absence of atherosclerotic factors. CAC were incubated in presence/absence (AP/C) of atherosclerotic factors and the secretion protein profile was analyzed by mass spectrometry using a label-free quantitative approach. Results were analyzed with MaxQuant and Perseus software. The figure includes a: (A) Volcano plot, which shows up- (red) and down-regulated (green) proteins, using a p-value < 0.05 and log2 ratio >1.35 or <−1.35 as cut-off values to consider significant changes; (B) principal component analysis (PCA) graph, clearly distinguishing between treated (CAC+AP) and untreated CAC (Control) supernatant based on the differential secretion profile; (C) hierarchical clustering of the proteins differentially present in the secretomes of untreated (C) and CAC stimulated with the atherosclerotic factors (AP); (D) validation by western blot of the proteomic results seen for trombospondin-1 (THBS1) and apolipoprotein E (APOE), both up-regulated in the secretome of CAC+AP stimulated cells.

