Figure 1.
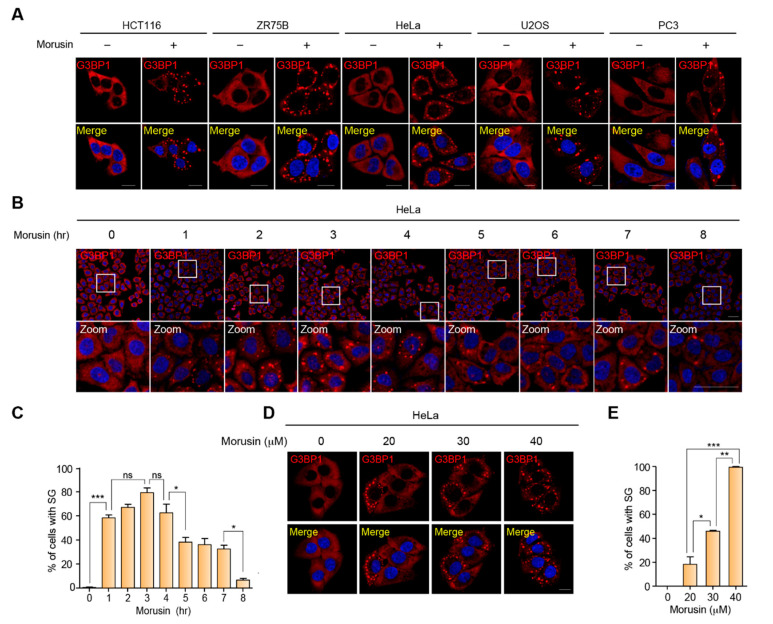
Morusin induces stress granules. (A) A representative image of immunostaining of G3BP1 in a panel of cancer cells treated with DMSO or 30 μM morusin for 3 h. Scale bar = 20 μm. (B) A representative image of immunostaining of G3BP1 in HeLa cells treated with DMSO or 30 μM morusin for 1 to 8 h at 1-h time intervals. Zoom indicates magnified images of white rectangles in the first row of images. Scale bar = 50 μm. (C) The graph displays the percentage of cells with G3BP1 puncta as in (B). (D) A representative image of immunostaining of G3BP1 in HeLa cells treated with DMSO or different concentrations of morusin (20, 30, and 40 μM) for 1 h. Scale bar = 20 μm. (E) The graph displays the percentage of cells with G3BP1 puncta as in (D). Data (C and E) are represented as the mean ± SEM and analyzed by one-way analysis of variance (ANOVA) followed by Bonferroni’s multiple comparison test (* p < 0.05, ** p < 0.01, *** p < 0.001 compared to the indicated points; n = 3).

