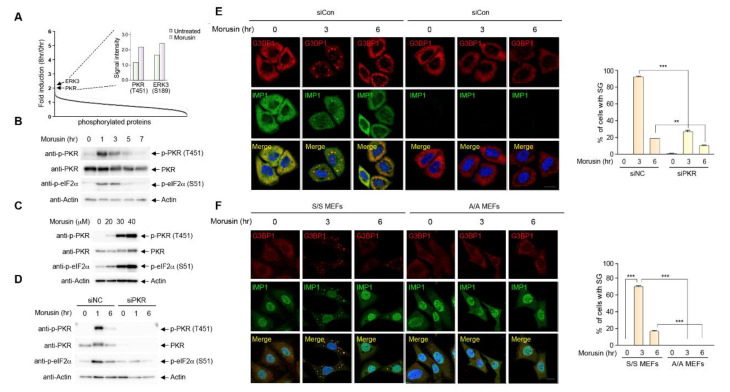
Figure 2.
Protein kinase R (PKR) activation is required for stress granule induction by morusin. (A) Fold induction of protein phosphorylation upon morusin treatment measured by signal intensities of phospho-antibody arrays in HeLa cells treated with 30 μM morusin for 8 h normalized to those of DMSO-treated cells. Inset indicates relative signal intensities of PKR(T451) and ERK3(S189) phosphorylation. (B) A representative immunoblot analysis of PKR and eIF2α phosphorylation in HeLa cells treated with DMSO or 30 μM morusin for 1−7 h at 2-h intervals. (C) A representative immunoblot analysis of PKR and eIF2α phosphorylation in HeLa cells treated with DMSO or different concentrations of morusin (20, 30, and 40 μM). (D) A representative immunoblot analysis of PKR and eIF2α phosphorylation in HeLa cells transfected with control siRNA or PKR siRNA, and treated with DMSO or 30 μM morusin for 1 or 6 h. (E) A representative image of immunostaining of G3BP1 and PKR in HeLa cells transfected with control siRNA or PKR siRNA, and treated with DMSO or 30 μM morusin for 3 or 6 h. (F) A representative image of immunostaining of G3BP1 and IMP1 in wild type (eif2α S/S) or eIF2α Ser51Ala MEFs (eif2α A/A) treated with DMSO or 30 μM morusin for 3 or 6 h. The graph (E,F) displays the percentage of the cells with G3BP1 puncta. Data are represented as the mean ± SEM and analyzed by one-way analysis of variance (ANOVA) followed by Bonferroni’s multiple comparison test (** p < 0.01, *** p < 0.001 compared to the indicated points; n = 3). (E,F) Scale bars represent 20 µm.

