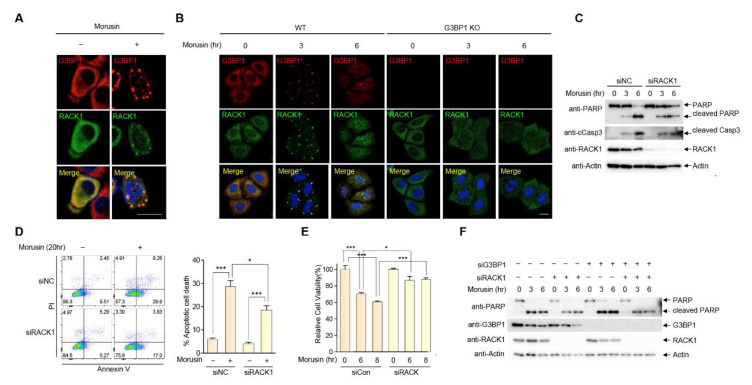
Figure 4.
RACK1 recruitment into stress granules attenuates morusin-mediated apoptosis. (A) A representative image of immunostaining of G3BP1 and RACK1 in HeLa cells treated with DMSO or 30 μM morusin for 3 h. (B) A representative confocal image of immunostaining of G3BP1 and RACK1 in WT or G3BP1 KO HeLa cells treated with DMSO or 30 μM morusin for 3 or 6 h. (C) A representative immunoblot analysis of PARP and caspase-3 cleavage in U2OS cells transfected with control siRNA or RACK1 siRNA, and treated with DMSO or 30 μM morusin for 3 or 6 h. (D) Analysis of morusin-induced apoptosis using flow cytometry. Wild-type or RACK1-depleted U2OS cells were treated with 20 μM morusin for 20 h, and apoptotic cells were assessed by flow cytometry. Annexin V-positive apoptotic cells are presented on the graph. (E) Cell viability assay in U2OS cells transfected with control siRNA or RACK1 siRNA, and treated with DMSO or 30 μM morusin for 6 to 8 h. (F) A representative immunoblot analysis of PARP and caspase-3 cleavage in U2OS cells transfected with control siRNA or siRNAs targeting G3BP1 and/or RACK1 as indicated. Data (D and E) are represented as the mean ± SEM and were analyzed by one-way analysis of variance (ANOVA) followed by Bonferroni’s multiple comparison test (* p < 0.05, *** p < 0.001 compared to the indicated points; n = 3). (A and B) Scale bars represent 20 µm.

