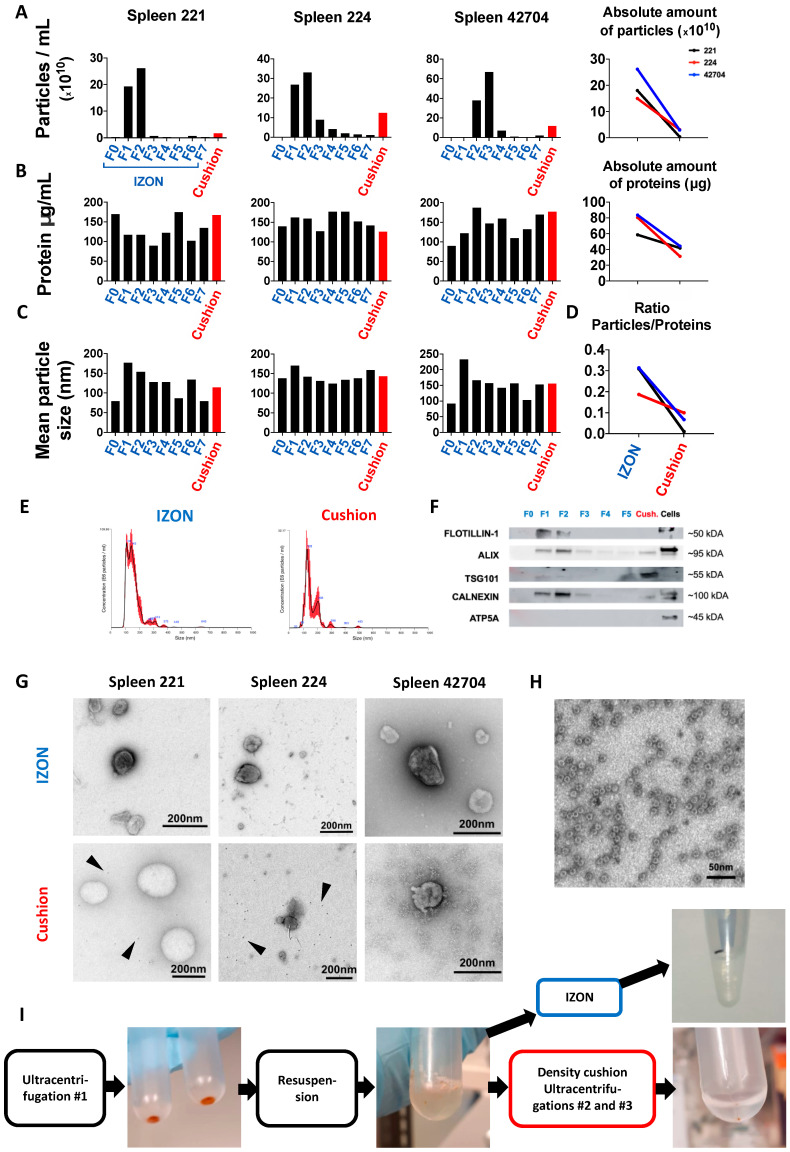
Figure 3.
Isolation and characterization of murine spleen sEVs. (A) Left: SEV concentration in the different IZON Fractions and “cushion” preparations for three samples analyzed by NTA. Right: Absolute number of particles in indicated preparations. For each sample, the particle concentration in the two peak fractions or in the cushion product was normalized to the final volume of elution. (B) Left: protein quantification in the indicated preparations assessed by BCA assay. Right: absolute amount of protein in indicated preparations (the protein concentration was normalized to the final volume of elution). (C) Mean particle size of all fractions and the “cushion” preparations analyzed by NTA. (D) Ratios of particles per protein amount are plotted for IZON and “cushion” fraction. (E) One representative particle distribution profile for an IZON fraction 2 (left) and a “cushion” preparation analyzed by NTA (Spleen 42704). (F) Immunoblotting analysis of FLOTILLIN-1, ALIX, TSG101, CALNEXIN, and ATP5A for the different IZON fractions, the “cushion” preparation and parental cells for one spleen sample (spleen 224). (G) Transmission electron microscopy (TEM) images of IZON peak fraction and “cushion” preparation for the three indicated samples. (H) TEM image of ferritin-like structures found in “cushion” preparations. (I) Pictures of the sEV pellet, resuspended sEVs prior to application on the sucrose density cushion, and final pellet in PBS before resuspension.

